With the end of the latest Star Wars trilogy, I wanted to compare, contrast, and explore Lucas vs Disney era domestic box office revenue.
The analysis and python code below will parse weekly ticket sales from Box Office Mojo, adjust revenue numbers for inflation, visualize, and attempt to uncover insights from the data.
TL;DR
- The top 3 revenue generating films (inflation-adjusted) are the first movie for each trilogy
- Disney era films do not make it past week 20 compared to the Lucas era
- On average, Lucas era movies generate 80% of their revenue within the first 10 weeks of release while Disney takes 2.8 weeks
Load modules
import pandas as pd
import matplotlib.pyplot as plt
import seaborn as sns

sns.set(style="darkgrid")
Define function
def movie_revenue(era, trilogy, movie, url):

  # RETRIEVE DATA FROM URL
  movie_data = pd.read_html(url)[0]

  # CUMULATIVE REVENUE: TRANSFORM TO FLOAT AND CALCULATE PER MILLION (1e6)
  movie_data['Cumulative_Revenue'] = movie_data['To Date'].str.replace(',', '').str.replace('$', '').astype(int)
  movie_data['Cumulative_Revenue'] = movie_data['Cumulative_Revenue'] / 1e6

  # WEEKLY REVENUE: TRANSFORM TO PER MILLION (1e6) FLOAT
  movie_data['Weekly_Revenue'] = movie_data['Weekly'].str.replace(',', '').str.replace('$', '').astype(int)
  movie_data['Weekly_Revenue'] = movie_data['Weekly_Revenue'] / 1e6

  # SELECT WEEK INDEX & REVENUE DATA
  movie_data = movie_data[['Week', 'Weekly_Revenue', 'Cumulative_Revenue']]

  # ADD ADDITIONAL COLUMNS
  movie_data['era'] = era
  movie_data['trilogy'] = trilogy
  movie_data['movie'] = movie

  return(movie_data)
Set parameters
# LIST: PRODUCER ERA, TRILOGY, MOVIE NAME, URL TO CRAWL
sw_list = [['Lucas','Prequel','The Phantom Menace','https://www.boxofficemojo.com/release/rl2742257153/weekly/'],
           ['Lucas','Prequel','Attack of the Clones','https://www.boxofficemojo.com/release/rl2809366017/weekly/'],
           ['Lucas','Prequel','Revenuge of the Sith','https://www.boxofficemojo.com/release/rl2943583745/weekly/'],
           ['Lucas','Original','A New Hope','https://www.boxofficemojo.com/release/rl2759034369/weekly/'],
           ['Lucas','Original','The Empire Strikes Back','https://www.boxofficemojo.com/release/rl2775811585/weekly/'],
           ['Lucas','Original','Return of the Jedi','https://www.boxofficemojo.com/release/rl2792588801/weekly/'],
           ['Disney','Sequel','The Force Awakens','https://www.boxofficemojo.com/release/rl2691925505/weekly/'],
           ['Disney','Sequel','The Last Jedi','https://www.boxofficemojo.com/release/rl2708702721/weekly/'],
           ['Disney','Sequel','The Rise of Skywalker','https://www.boxofficemojo.com/release/rl3305145857/weekly/'],
           ['Disney','SW Story','Rogue One','https://www.boxofficemojo.com/release/rl2557707777/weekly/'],
           ['Disney','SW Story','Solo','https://www.boxofficemojo.com/release/rl1954383361/weekly/']]
Retrieve and parse data
star_wars = []

for m in sw_list:
  data = movie_revenue(m[0], m[1], m[2], m[3])
  star_wars.append(data)

star_wars = pd.concat(star_wars)
Spot check
from random import randint

star_wars.iloc[randint(0,len(star_wars))]
## Week 10
## Weekly_Revenue 0.762516
## Cumulative_Revenue 514.326
## era Disney
## trilogy Sequel
## movie The Rise of Skywalker
## Name: 9, dtype: objectInflation-adjusted revenue
# MOVIE TITLE
m = []
for t in sw_list:
  title = t[2]
  m.append(title)

# YEAR OF MOVIE
y = [2000, 2002, 2005, 1977, 1980, 1983, 2016, 2018, 2019, 2017, 2018]

# INFLATION RATE (https://www.bls.gov/data/inflation_calculator.htm)
i = [0.497, 0.433, 0.32, 3.254, 2.129, 1.588, 0.074, 0.027, 0.008, 0.052, 0.027]

# JOIN ALL THREE LISTS
inflation = list(zip(m, y, i))

# CONVERT TO PANDAS DATAFRAME
inflation = pd.DataFrame(inflation)

# CREATE & APPLY COLUMN NAMES
labels = ["movie", "year", "inflation_rate"]
inflation.columns = labels

# COMBINE DATAFRAMES
star_wars_adjusted = star_wars.merge(inflation, how='left', on='movie')

# INFLATION-ADJUSTED REVENUE: WEEKLY & CUMULATIVE
star_wars_adjusted['Adjusted Weekly Revenue'] = star_wars_adjusted['Weekly_Revenue'] * (1 + star_wars_adjusted['inflation_rate'])
star_wars_adjusted['Adjusted Cumulative Revenue'] = star_wars_adjusted['Cumulative_Revenue'] * (1 + star_wars_adjusted['inflation_rate'])
Final spot check
star_wars_adjusted.iloc[randint(0,len(star_wars_adjusted))]## Week 46
## Weekly_Revenue 0.792809
## Cumulative_Revenue 213.955
## era Lucas
## trilogy Original
## movie A New Hope
## year 1977
## inflation_rate 3.254
## Adjusted Weekly Revenue 3.37261
## Adjusted Cumulative Revenue 910.166
## Name: 101, dtype: objectWhat is the total ticket sales for the entire franchise?
star_wars_adjusted.agg({'Adjusted Weekly Revenue':'sum'})[0]## 6125.216885688999Over $6.6 billion in gross revenue (inflation-adjusted) was made from the US box office alone.
Which era produced the most revenue?
era_comparison = star_wars_adjusted.groupby(['era']).agg({'Adjusted Weekly Revenue':'sum'}).reset_index()
era_comparison = era_comparison.sort_values('Adjusted Weekly Revenue', ascending=False).rename(columns={'Adjusted Weekly Revenue':'total_revenue'})
era_comparison
## era total_revenue
## 1 Lucas 3183.601435
## 0 Disney 2941.615451The winner here goes to the Lucas era at 56% of total domestic ticket sales by a difference of $731M (inflation-adjusted) over Disney.
How much revenue did each movie generate?
star_wars_summary = star_wars_adjusted.groupby(['era','trilogy','movie']).agg({'Adjusted Weekly Revenue':'sum'}).reset_index()
star_wars_summary = star_wars_summary.sort_values('Adjusted Weekly Revenue', ascending=False).rename(columns={'Adjusted Weekly Revenue':'total_revenue'})
star_wars_summary
## era trilogy movie total_revenue
## 2 Disney Sequel The Force Awakens 1005.975230
## 10 Lucas Prequel The Phantom Menace 642.104488
## 6 Lucas Original Return of the Jedi 637.805882
## 3 Disney Sequel The Last Jedi 636.926279
## 5 Lucas Original A New Hope 609.842877
## 0 Disney SW Story Rogue One 559.850545
## 4 Disney Sequel The Rise of Skywalker 519.324162
## 9 Lucas Prequel Revenuge of the Sith 501.957162
## 8 Lucas Prequel Attack of the Clones 433.039987
## 7 Lucas Original The Empire Strikes Back 358.851039
## 1 Disney SW Story Solo 219.539235A few points to highlight:
- The first movie for each trilogy shows up in the top 3 on our inflation-adjusted list
- Disney’s “The Force Awakens” generated over one billion dollars in domestic box office revenue (!)
- Why was this so popular? My first guess is older fans who now have kids and Disney’s powerhouse marekting machine
- Solo (Disney) performed the worst coming in just shy of $220M (inflation-adjusted), nearly -50% less than “Attack of the Clones” (Lucas)
This is interesting but movie industry analysts already report on these statistics in some way, shape or form.
Let’s take a different approach by visualizing the revenue run rate for each movie after its release.
What is the weekly cumulative revenue for each movie?
plt.figure(figsize=(20,15))

g = sns.FacetGrid(star_wars_adjusted, col="trilogy", hue="movie", col_wrap=2, height=5)
g = g.map(plt.plot, "Week", "Adjusted Cumulative Revenue", marker="o")
g = g.add_legend().set_titles("{col_name}").set_xlabels("Weeks Since Release").set_ylabels("Cumulative Revenue ($ Millions)")

plt.subplots_adjust(top=0.90)
plt.suptitle('STAR WARS\nWeekly Cumulative Revenue (inflation-adjusted)', fontsize=16)
plt.figtext(0.9, 0.02, "by: @eeysirhc", horizontalalignment="right")
plt.figtext(0.9, 0.01, "source: Box Office Mojo", horizontalalignment="right")

plt.show()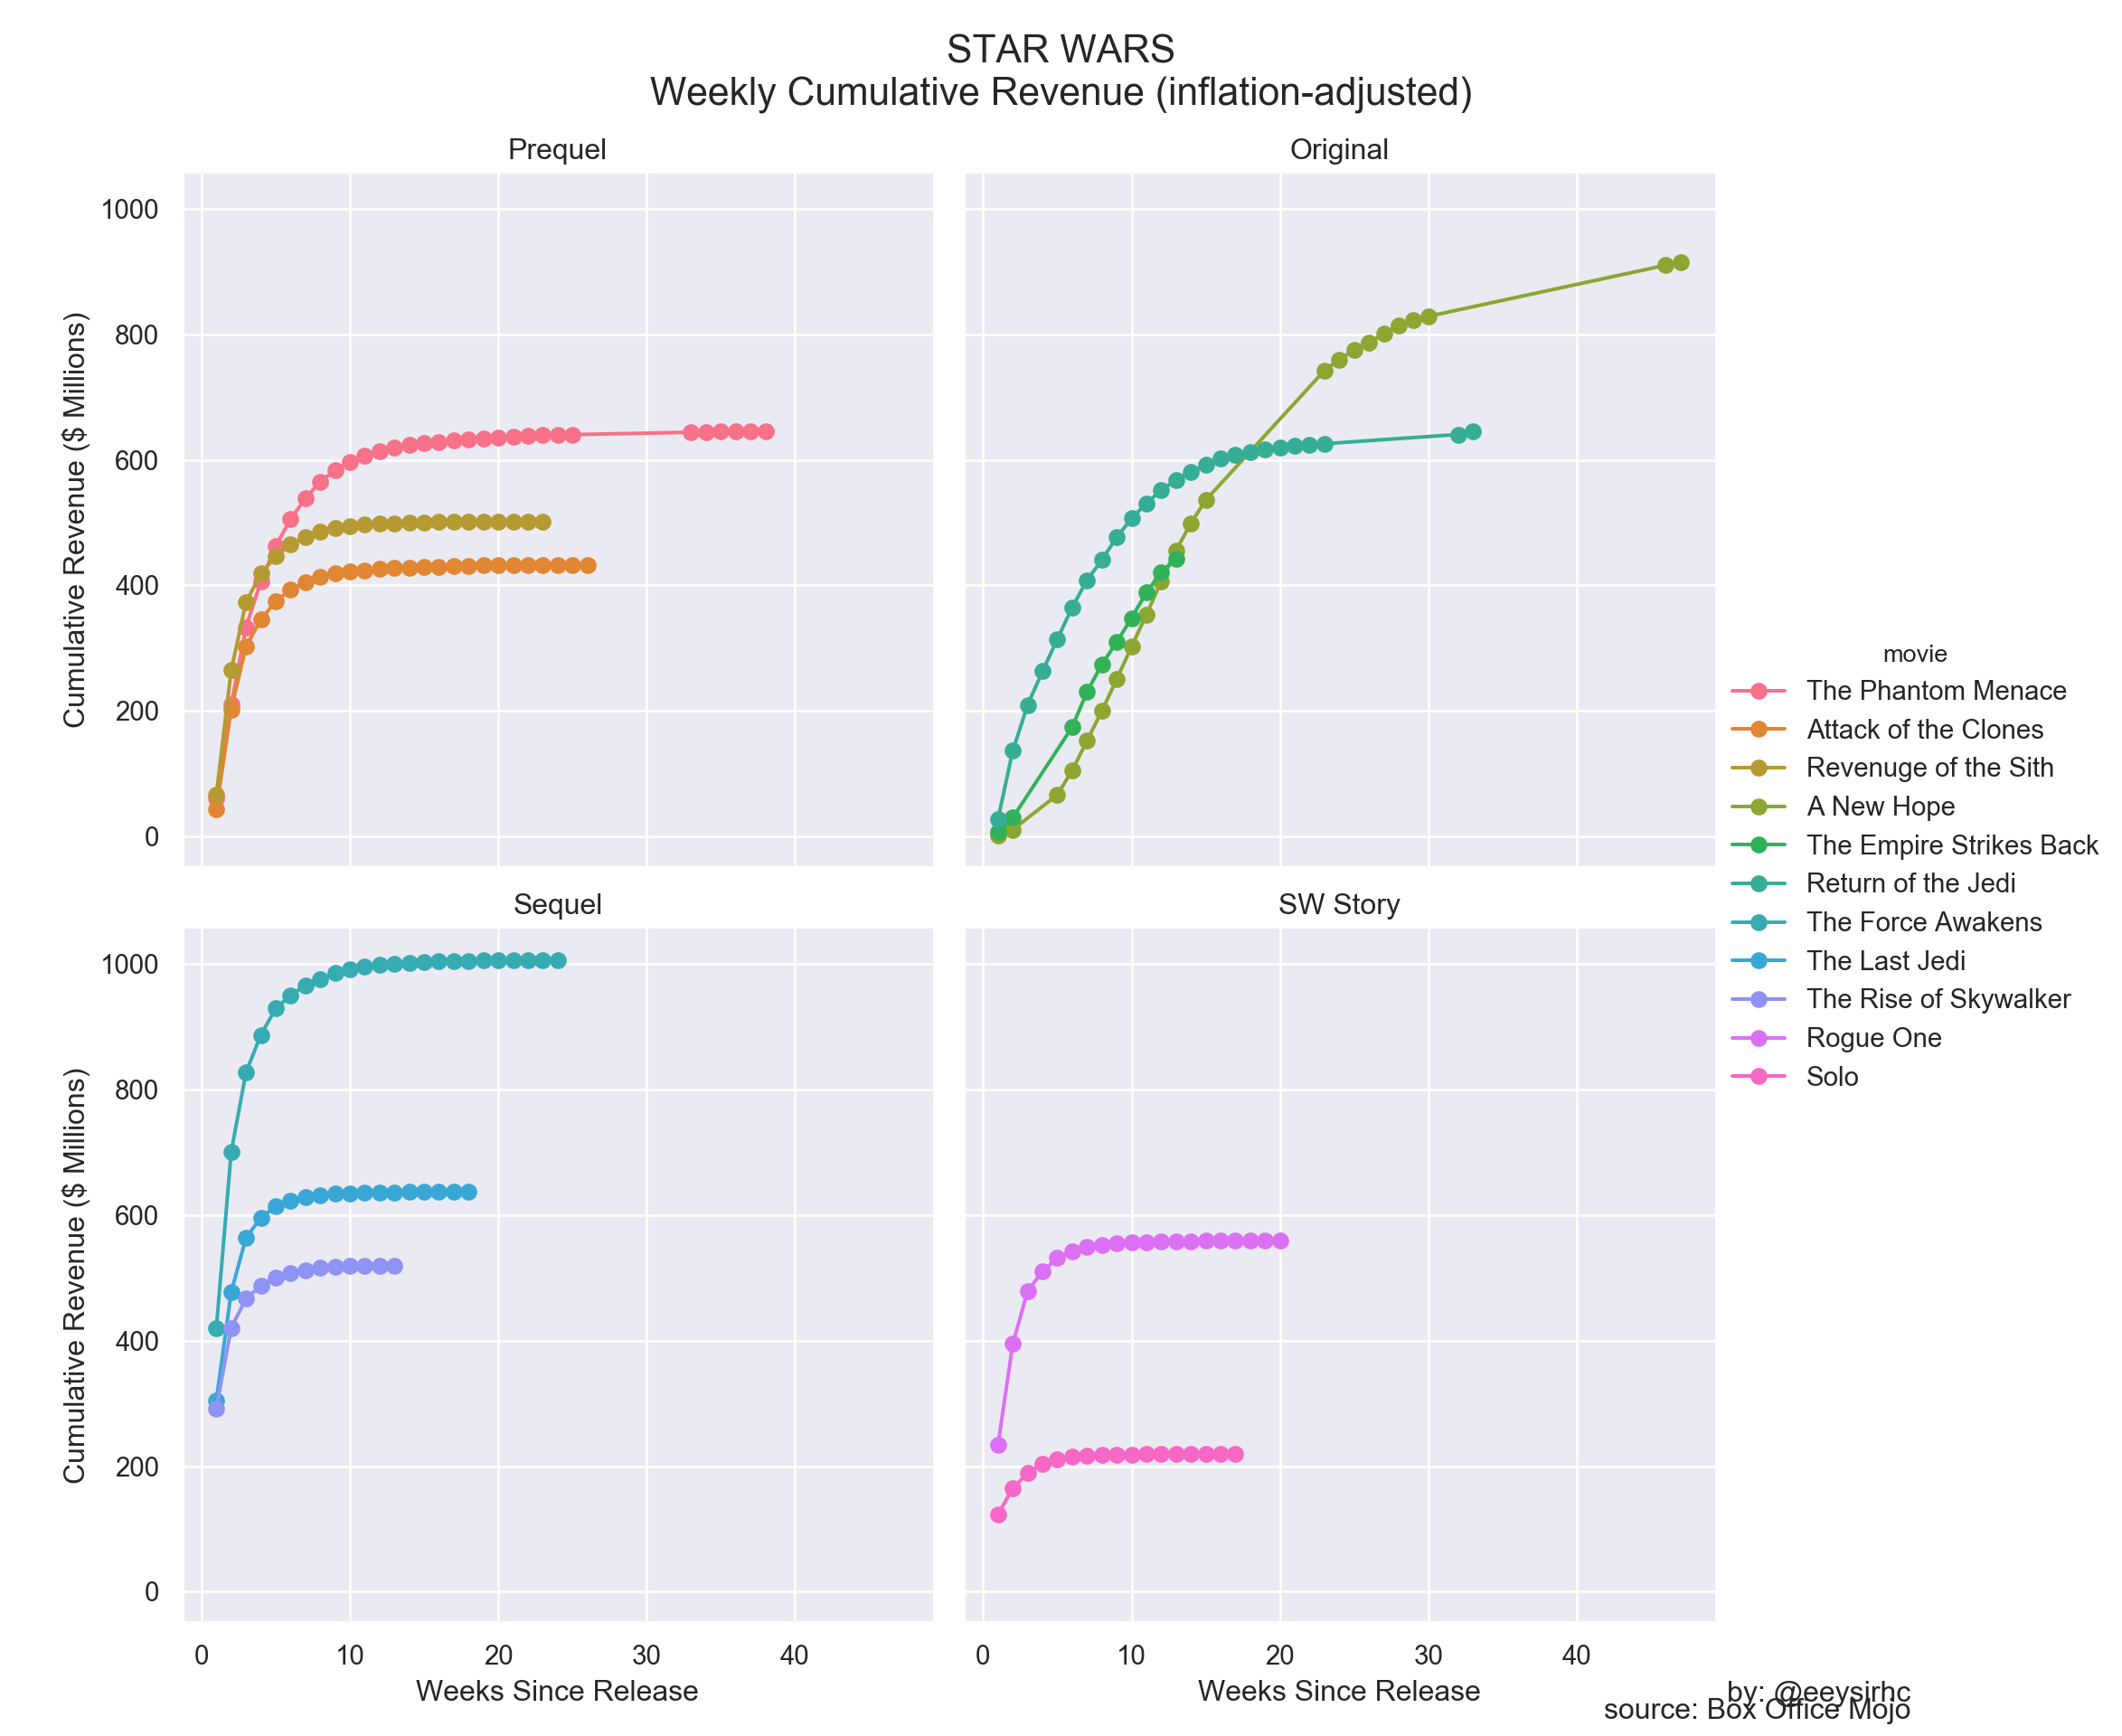
Note: “The Empire Strikes Back” (Lucas) has inaccurate data for weekly numbers
Now this is something different:
- With the exception of “The Force Awakens”, all Disney era films do not make it past week 20
- The Lucas original trilogy & “The Phantom Menace” exhibits a gradual accumulation in revenue over time
- The cumulative revenue for Disney movies (and the last two from the Lucas prequel) appear to flatten within the first month of release
I suspect we might be onto something here.
How long does it take to achieve 80% of total revenue?
# WEEKLY REVENUE PER MOVIE
star_wars_total = star_wars_adjusted.groupby(['movie','Week']).agg({'Adjusted Weekly Revenue': 'sum'})

# WEEKLY % OF TOTAL
star_wars_pct = star_wars_total.groupby(level=0).apply(lambda x:
                                       100 * x / float(x.sum())).reset_index()

# WEEKLY CUMULATIVE % OF TOTAL CONTRIBUTION
star_wars_pct['cumulative_contribution'] = star_wars_pct.groupby(['movie'])['Adjusted Weekly Revenue'].cumsum()

# VISUALIZE
plt.figure(figsize=(20,15))

p = sns.FacetGrid(star_wars_pct, col="movie", hue="movie", col_wrap=3, height=5)
p = p.map(plt.plot, "Week", "cumulative_contribution", marker="o")
p = p.add_legend().set_titles("{col_name}").set_xlabels("Weeks Since Release").set_ylabels("% of Total Contribution")

plt.subplots_adjust(top=0.90)
plt.suptitle('STAR WARS\nWeekly Revenue Contribution (inflation-adjusted)', fontsize=16)
plt.figtext(0.9, 0.02, "by: @eeysirhc", horizontalalignment="right")
plt.figtext(0.9, 0.01, "source: Box Office Mojo", horizontalalignment="right")

plt.show()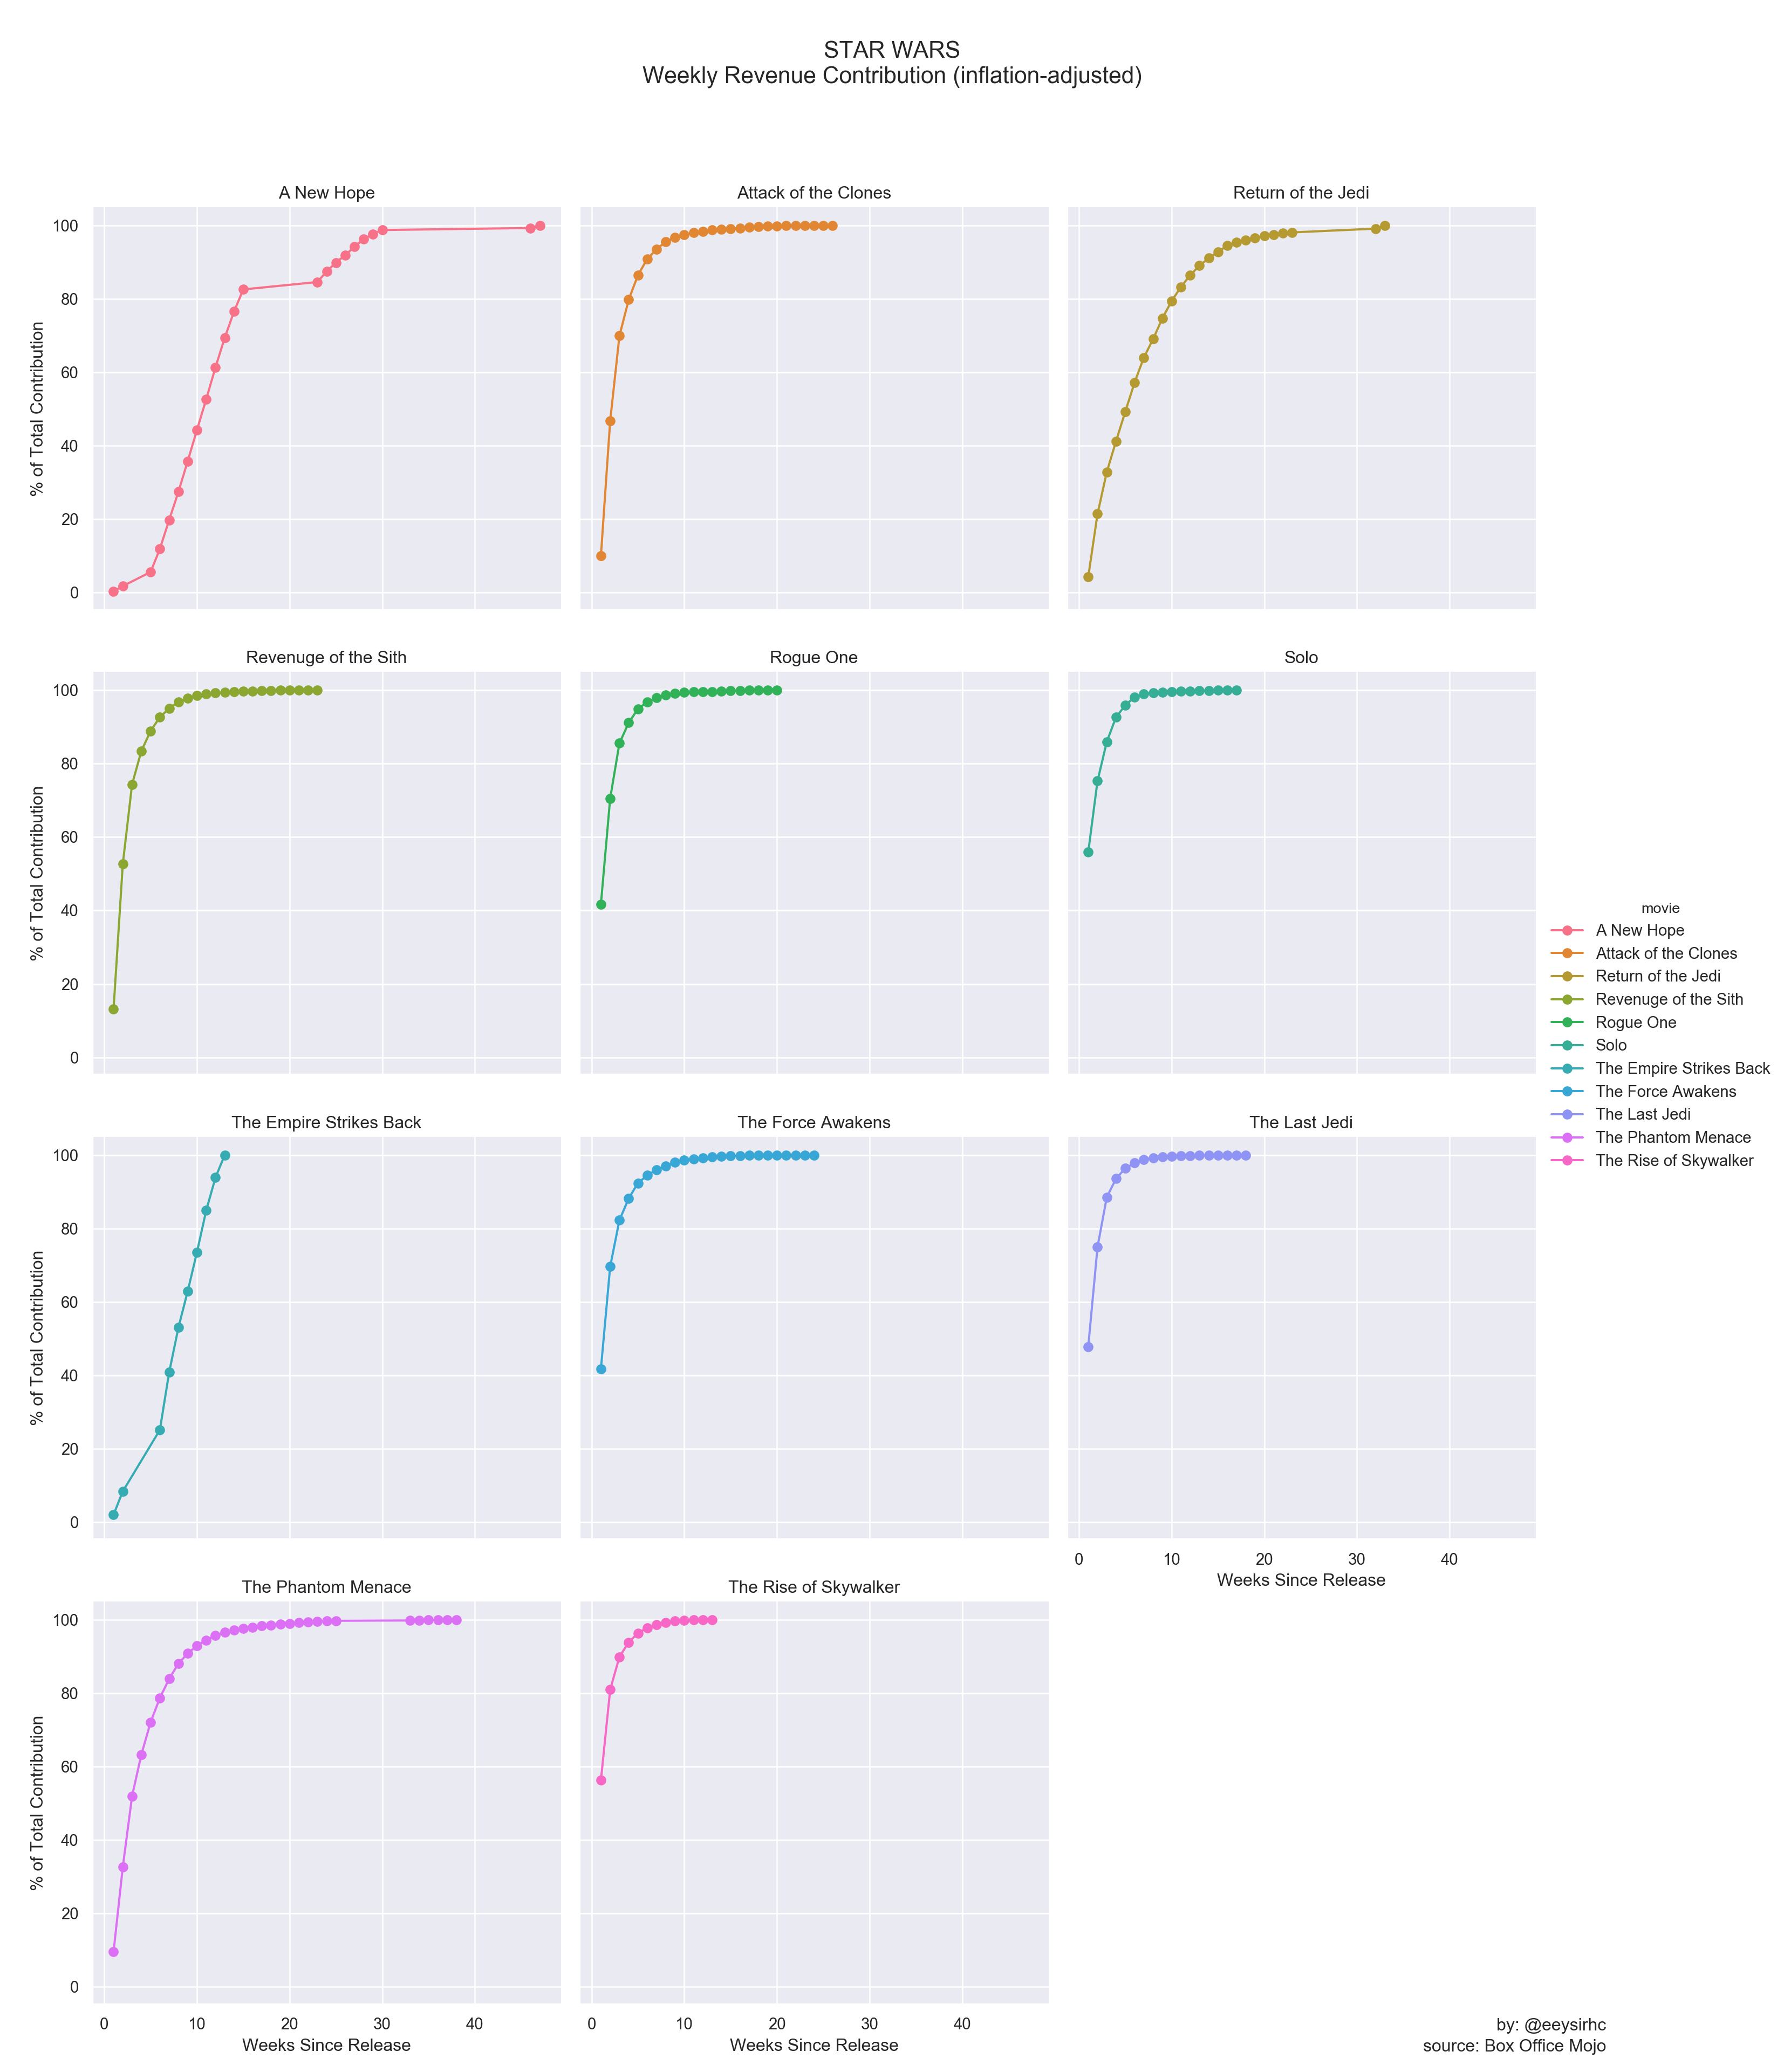
# FILTER CONTRIBUTION > 80%
threshold = star_wars_pct[star_wars_pct['cumulative_contribution'] > 80]
threshold_parsed = threshold.loc[threshold.groupby('movie').cumulative_contribution.idxmin()]
threshold_parsed = threshold_parsed[['movie','Week','cumulative_contribution']].sort_values('Week').merge(star_wars_summary, how="left", on="movie")
threshold_parsed[['era','movie','Week','total_revenue']]
## era movie Week total_revenue
## 0 Disney The Rise of Skywalker 2 519.324162
## 1 Disney Rogue One 3 559.850545
## 2 Disney Solo 3 219.539235
## 3 Disney The Force Awakens 3 1005.975230
## 4 Disney The Last Jedi 3 636.926279
## 5 Lucas Revenuge of the Sith 4 501.957162
## 6 Lucas Attack of the Clones 5 433.039987
## 7 Lucas The Phantom Menace 7 642.104488
## 8 Lucas Return of the Jedi 11 637.805882
## 9 Lucas The Empire Strikes Back 11 358.851039
## 10 Lucas A New Hope 15 609.842877This illustrates there is a clear distinction between the two Star Wars producers.
On average, Disney era movies generate 80% of their revenue within the first 2.8 weeks of release while Lucas takes 10 weeks (excludes “The Empire Strikes Back”).
A few follow-up questions quickly come to mind:
- How many movie theaters were there in the 1970s? 2000s? 2010s?
- Have moviegoers been forced to travel to a few central locations (ex: strip malls) instead of being dispersed throughout a region?
- How is Disney delivering their content to movie theaters?
- If it’s digital, could this explain the steep vs gradual revenue generated over time because the film doesn’t need to be physically delivered to all theaters?
- Has the movie industry evolved to the point where logistics and operations are now a science?
This definitely warrants further exploration and I encourage the reader (or movie enthusiast) to take this and run with it.
If you found this article useful or interesting then please do not hesitate to share with others!