Analyzing data for #tidytuesday week of 11/27/2018 (source)
# LOAD PACKAGES AND PARSE DATA
library(tidyverse)
library(scales)
library(RColorBrewer)
library(forcats)

bridges_raw <- read_csv("https://raw.githubusercontent.com/rfordatascience/tidytuesday/master/data/2018/2018-11-27/baltimore_bridges.csv")

bridges <- bridges_raw
Do bridge conditions get better over time?
# REORDER BRIDGE_CONDITION FACTORS
x <- bridges
x$bridge_condition <- as.factor(x$bridge_condition)
x$bridge_condition <- factor(x$bridge_condition, levels = c("Poor", "Fair", "Good"))

x %>%
  filter(yr_built >= 1900) %>% # removing 2017 due to outlier
  select(lat, long, yr_built, bridge_condition, avg_daily_traffic) %>%
  group_by(yr_built, bridge_condition) %>%
  summarize(avg_daily_traffic = mean(avg_daily_traffic)) %>%
  ggplot() +
  geom_col(aes(yr_built, avg_daily_traffic, fill = bridge_condition),
           alpha = 0.3) +
  scale_y_continuous(label = comma_format(),
                     limits = c(0, 223000)) +
  scale_fill_brewer(palette = 'Set1') +
  scale_color_brewer(palette = 'Set1') +
  geom_smooth(aes(yr_built, avg_daily_traffic,
                  color = bridge_condition),
              se = FALSE) +
  theme_bw() +
  labs(x = "",
        y = "",
        title = "Baltimore bridges: average daily traffic by year built",
       subtitle = "Applied smoothing to highlight differences in bridge conditions and dampen outliers",
       fill = "Bridge Condition",
color = "Bridge Condition") 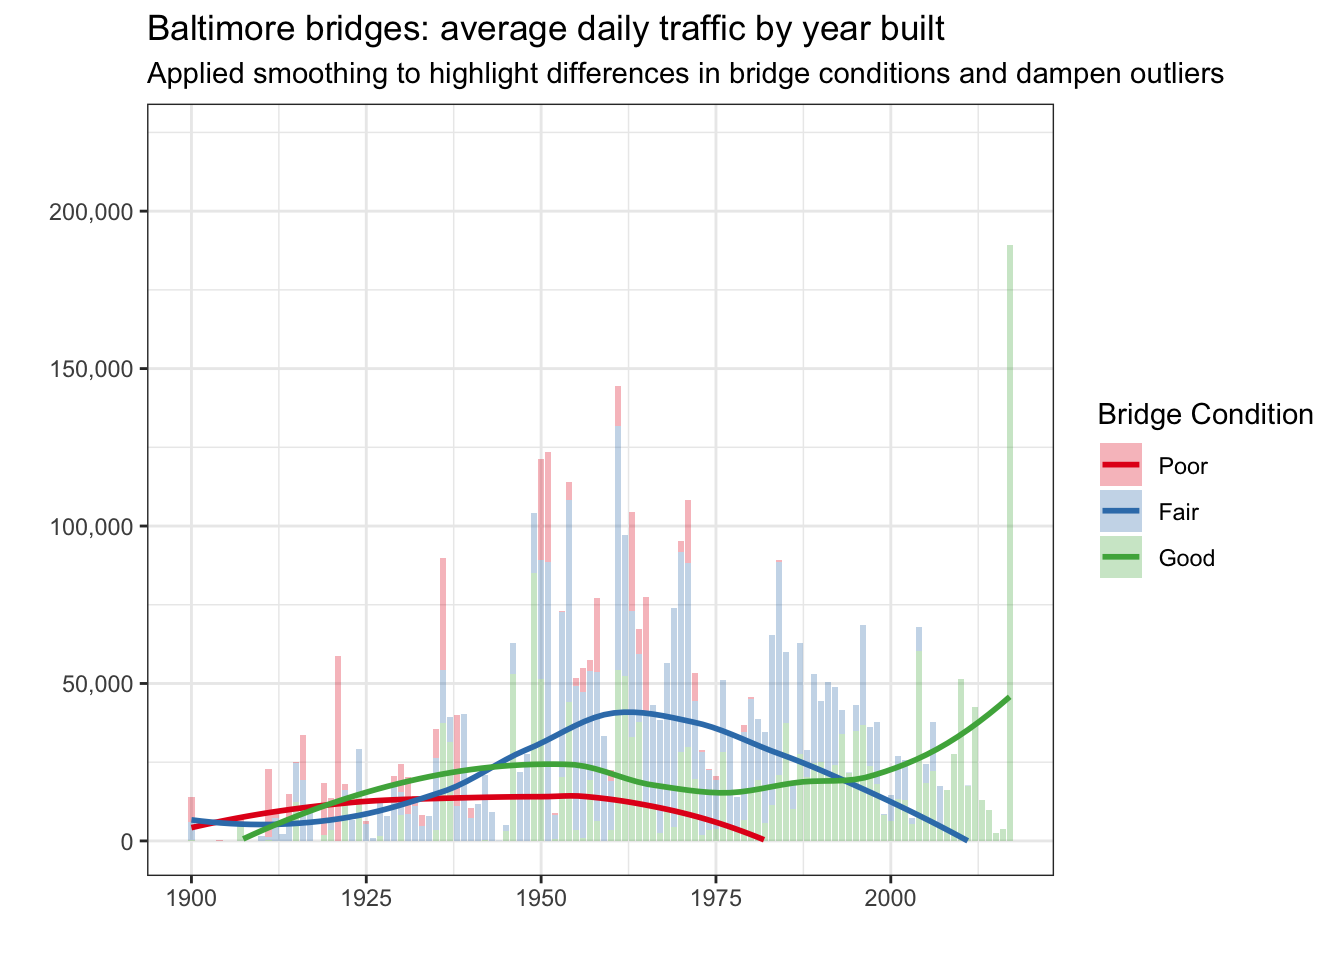
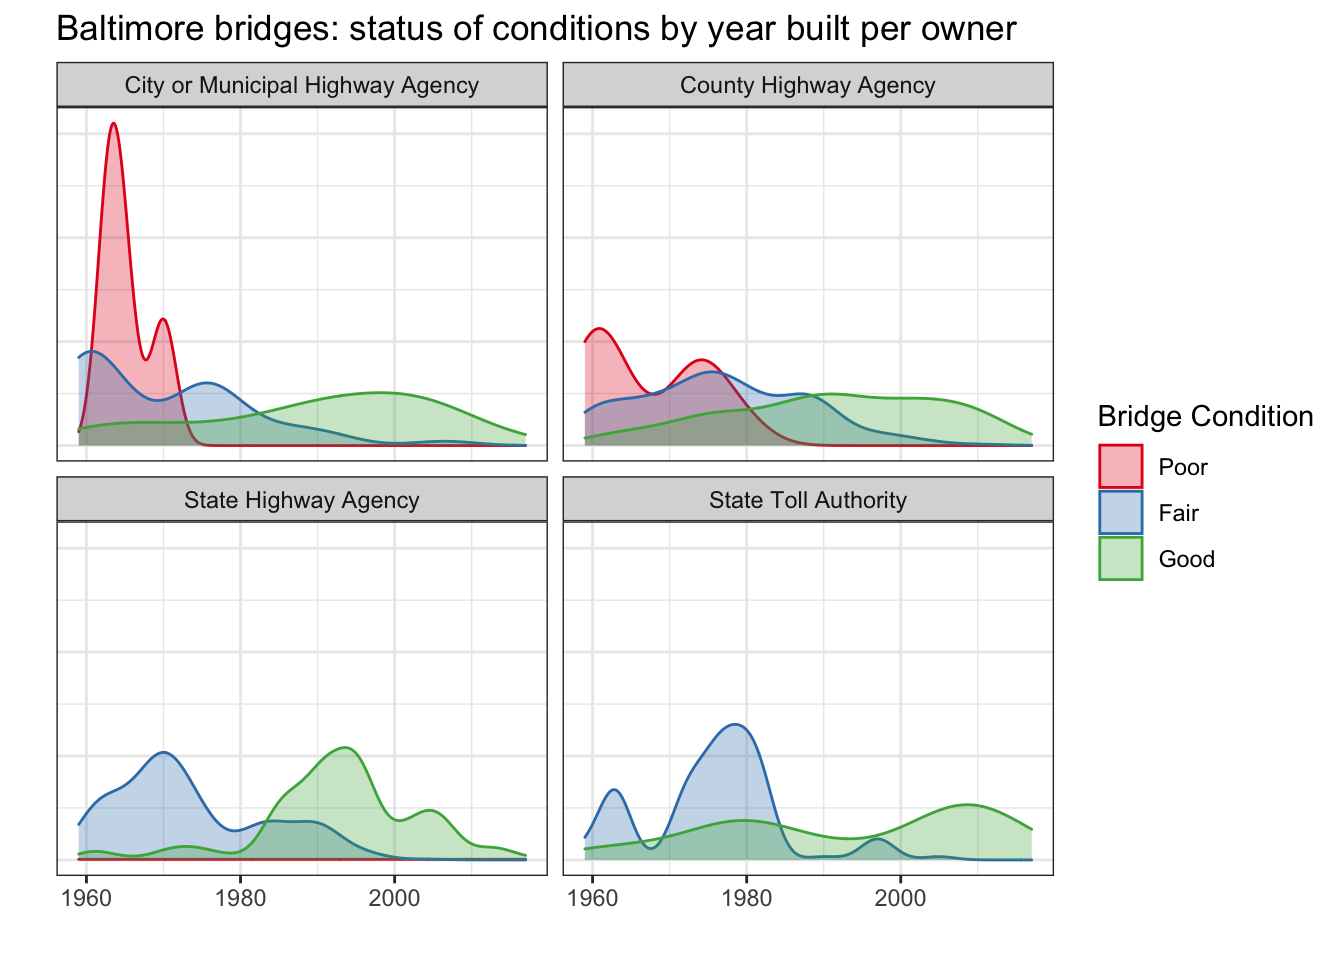
Is the improvement consistent across all bridge owners?
x %>%
  select(owner, bridge_condition, yr_built) %>%
  filter(owner != "Army", owner != "National Park Service", owner != "Navy/Marines",
         owner != "Other Local Agencies", owner != "Private (other than railroad)",
         owner != "Town or Township Highway Agency", owner != "Other State Agencies") %>%
  filter(yr_built > 1958) %>%
  ggplot() +
  geom_density(aes(x = yr_built, fill = bridge_condition, color = bridge_condition),
               alpha = 0.3) +
  facet_wrap(~owner) +
  theme_bw() +
  scale_fill_brewer(palette = 'Set1') +
  scale_color_brewer(palette = 'Set1') +
  labs(x = "",
       y = "",
       fill = "Bridge Condition",
       color = "Bridge Condition",
       title = "Baltimore bridges: status of conditions by year built per owner") +
  theme(axis.ticks.y = element_blank(),
        axis.text.y = element_blank())