Data from #tidytuesday week of 2020-05-26 (source)
If you are looking for the R script then you can find it here
Load packages
library(tidyverse)
library(ggrepel)
library(FactoMineR)
Download data
bc_raw <- read_csv('https://raw.githubusercontent.com/rfordatascience/tidytuesday/master/data/2020/2020-05-26/boston_cocktails.csv') Data processing
Standardize cases
bc_raw %>%
  count(ingredient, sort = TRUE) %>%
  filter(str_detect(ingredient, "red pepper sauce"))
## # A tibble: 2 x 2
## ingredient n
## <chr> <int>
## 1 Hot red pepper sauce 4
## 2 hot red pepper sauce 1Let’s fix that by making all ingredient values to lower case:
bc <- bc_raw %>%
  mutate(ingredient = str_to_lower(ingredient)) %>%
  distinct() %>%
  select(name, ingredient)
And to make sure it works…
bc %>%
  count(ingredient, sort = TRUE) %>%
  filter(str_detect(ingredient, "red pepper sauce"))
## # A tibble: 1 x 2
## ingredient n
## <chr> <int>
## 1 hot red pepper sauce 5Fix untidy data
To follow “tidy” principles, we need one row per observation.
bc %>%
  filter(str_detect(ingredient, ","))
## # A tibble: 85 x 2
## name ingredient
## <chr> <chr>
## 1 John Collins orange and lemon wheels, maraschino cherry
## 2 Irish Shillelagh fresh raspberries and strawberries, 2 peach slices, ma…
## 3 Underneath The Mango… lime wedge, sweet chili powder
## 4 Emperor Norton's Mis… fresh strawberries, cut in halves
## 5 Toasted Drop lemon wedge, cinnamon sugar
## 6 Stockholm 75 lemon wedge, superfine sugar
## 7 Salty Dog lemon wedge, coarse salt
## 8 Rouxby Red for glass lemon wedge, coarse salt
## 9 Redhead Martini strawberries, cut into halves
## 10 Canadian Breeze pineapple wedge, maraschino cherry
## # … with 75 more rowsWe can reformat this by separating the commas then adding a new row for each cocktail per ingredient.
# CLEAN DATAFRAME
bc_tidy <- bc %>%
  filter(!str_detect(ingredient, ","))

# EXTRACT UNTIDY DATA THEN CLEAN
bc_untidy <- bc %>%
  filter(str_detect(ingredient, ",")) %>%
  mutate(ingredient = str_split(ingredient, ", ")) %>%
  unnest(ingredient)

# COMBINE BOTH DATAFRAMES
bc_clean <- rbind(bc_tidy, bc_untidy) %>%
  distinct()

bc_untidy
## # A tibble: 193 x 2
## name ingredient
## <chr> <chr>
## 1 John Collins orange and lemon wheels
## 2 John Collins maraschino cherry
## 3 Irish Shillelagh fresh raspberries and strawberries
## 4 Irish Shillelagh 2 peach slices
## 5 Irish Shillelagh maraschino cherry
## 6 Underneath The Mango Tree lime wedge
## 7 Underneath The Mango Tree sweet chili powder
## 8 Emperor Norton's Mistress fresh strawberries
## 9 Emperor Norton's Mistress cut in halves
## 10 Toasted Drop lemon wedge
## # … with 183 more rowsReduce cardinality
Our dataset has more than 550 unique ingredients so let’s trim that down to the ingredients that are used in ten or more cocktails.
bc_clean %>%
  distinct(ingredient) %>%
  count()
## # A tibble: 1 x 1
## n
## <int>
## 1 553n_ingredients <- bc_clean %>%
count(ingredient, sort = TRUE) %>%
filter(n > 10)Normalize ingredients
Similar to our case statement section above, let’s make sure our ingredients are consolidated to the same format.
df <- bc_clean %>%
  inner_join(n_ingredients) %>%
  select(-n) %>%
  mutate(ingredient = str_replace_all(ingredient, "-", "_"),
         ingredient = str_replace_all(ingredient, " ", "_"),
         ingredient = str_replace_all(ingredient, "old_mr._boston_", ""),
         ingredient = str_replace_all(ingredient, "old_thompson_", ""))
Multiple Correspondence Analysis (MCA)
Our dataset is mostly categorical so MCA can help identify and highlight any underlying structures.
Format data for MCA
df_mca_processed <- df %>%
  mutate(value = 1) %>%
  pivot_wider(names_from = ingredient) %>%
  replace(is.na(.), 0) %>%
  select(-name) %>%
  mutate_if(is.double, as.factor)

mca_results <- MCA(df_mca_processed, graph = FALSE)
Shape data to tidy structure
mca_df <- data.frame(mca_results$var$coord)

mca_final <- rownames_to_column(mca_df, var = "rowname") %>%
  as_tibble() %>%
  filter(str_detect(rowname, "_1")) %>%
  mutate(variable = str_replace_all(rowname, "_1", "")) %>%
  select(variable, everything(), -rowname) %>%
  mutate(highlight = case_when(str_detect(variable, "gin") ~ "gin",
                               str_detect(variable, "rum") ~ "rum",
                               str_detect(variable, "vodka") ~ "vodka",
                               str_detect(variable, "whiskey") ~ "whiskey",
                               str_detect(variable, "brandy") ~ "brandy",
                               str_detect(variable, "bourbon") ~ "bourbon",
                               str_detect(variable, "tequila") ~ "tequila"))
Final plot
mca_final %>%
  ggplot(aes(x = Dim.1, y = Dim.2, label = variable, color = highlight)) +
  geom_density2d(color = "gray90") +
  geom_point(show.legend = FALSE) +
  geom_text_repel(show.legend = FALSE) +
  labs(x = "D1", y = "D2",
       title = "Multiple correspondence analysis (MCA) on the most common cocktail ingredients",
       subtitle = "Closer points suggest they are typically mixed together",
       caption  = "by: @eeysirhc\nsource: Mr. Boston Bartender's Guide") +
  theme_minimal(base_size = 15) +
  theme(axis.text.y = element_blank(),
        axis.text.x = element_blank(),
        panel.grid.major = element_blank(),
panel.grid.minor = element_blank()) 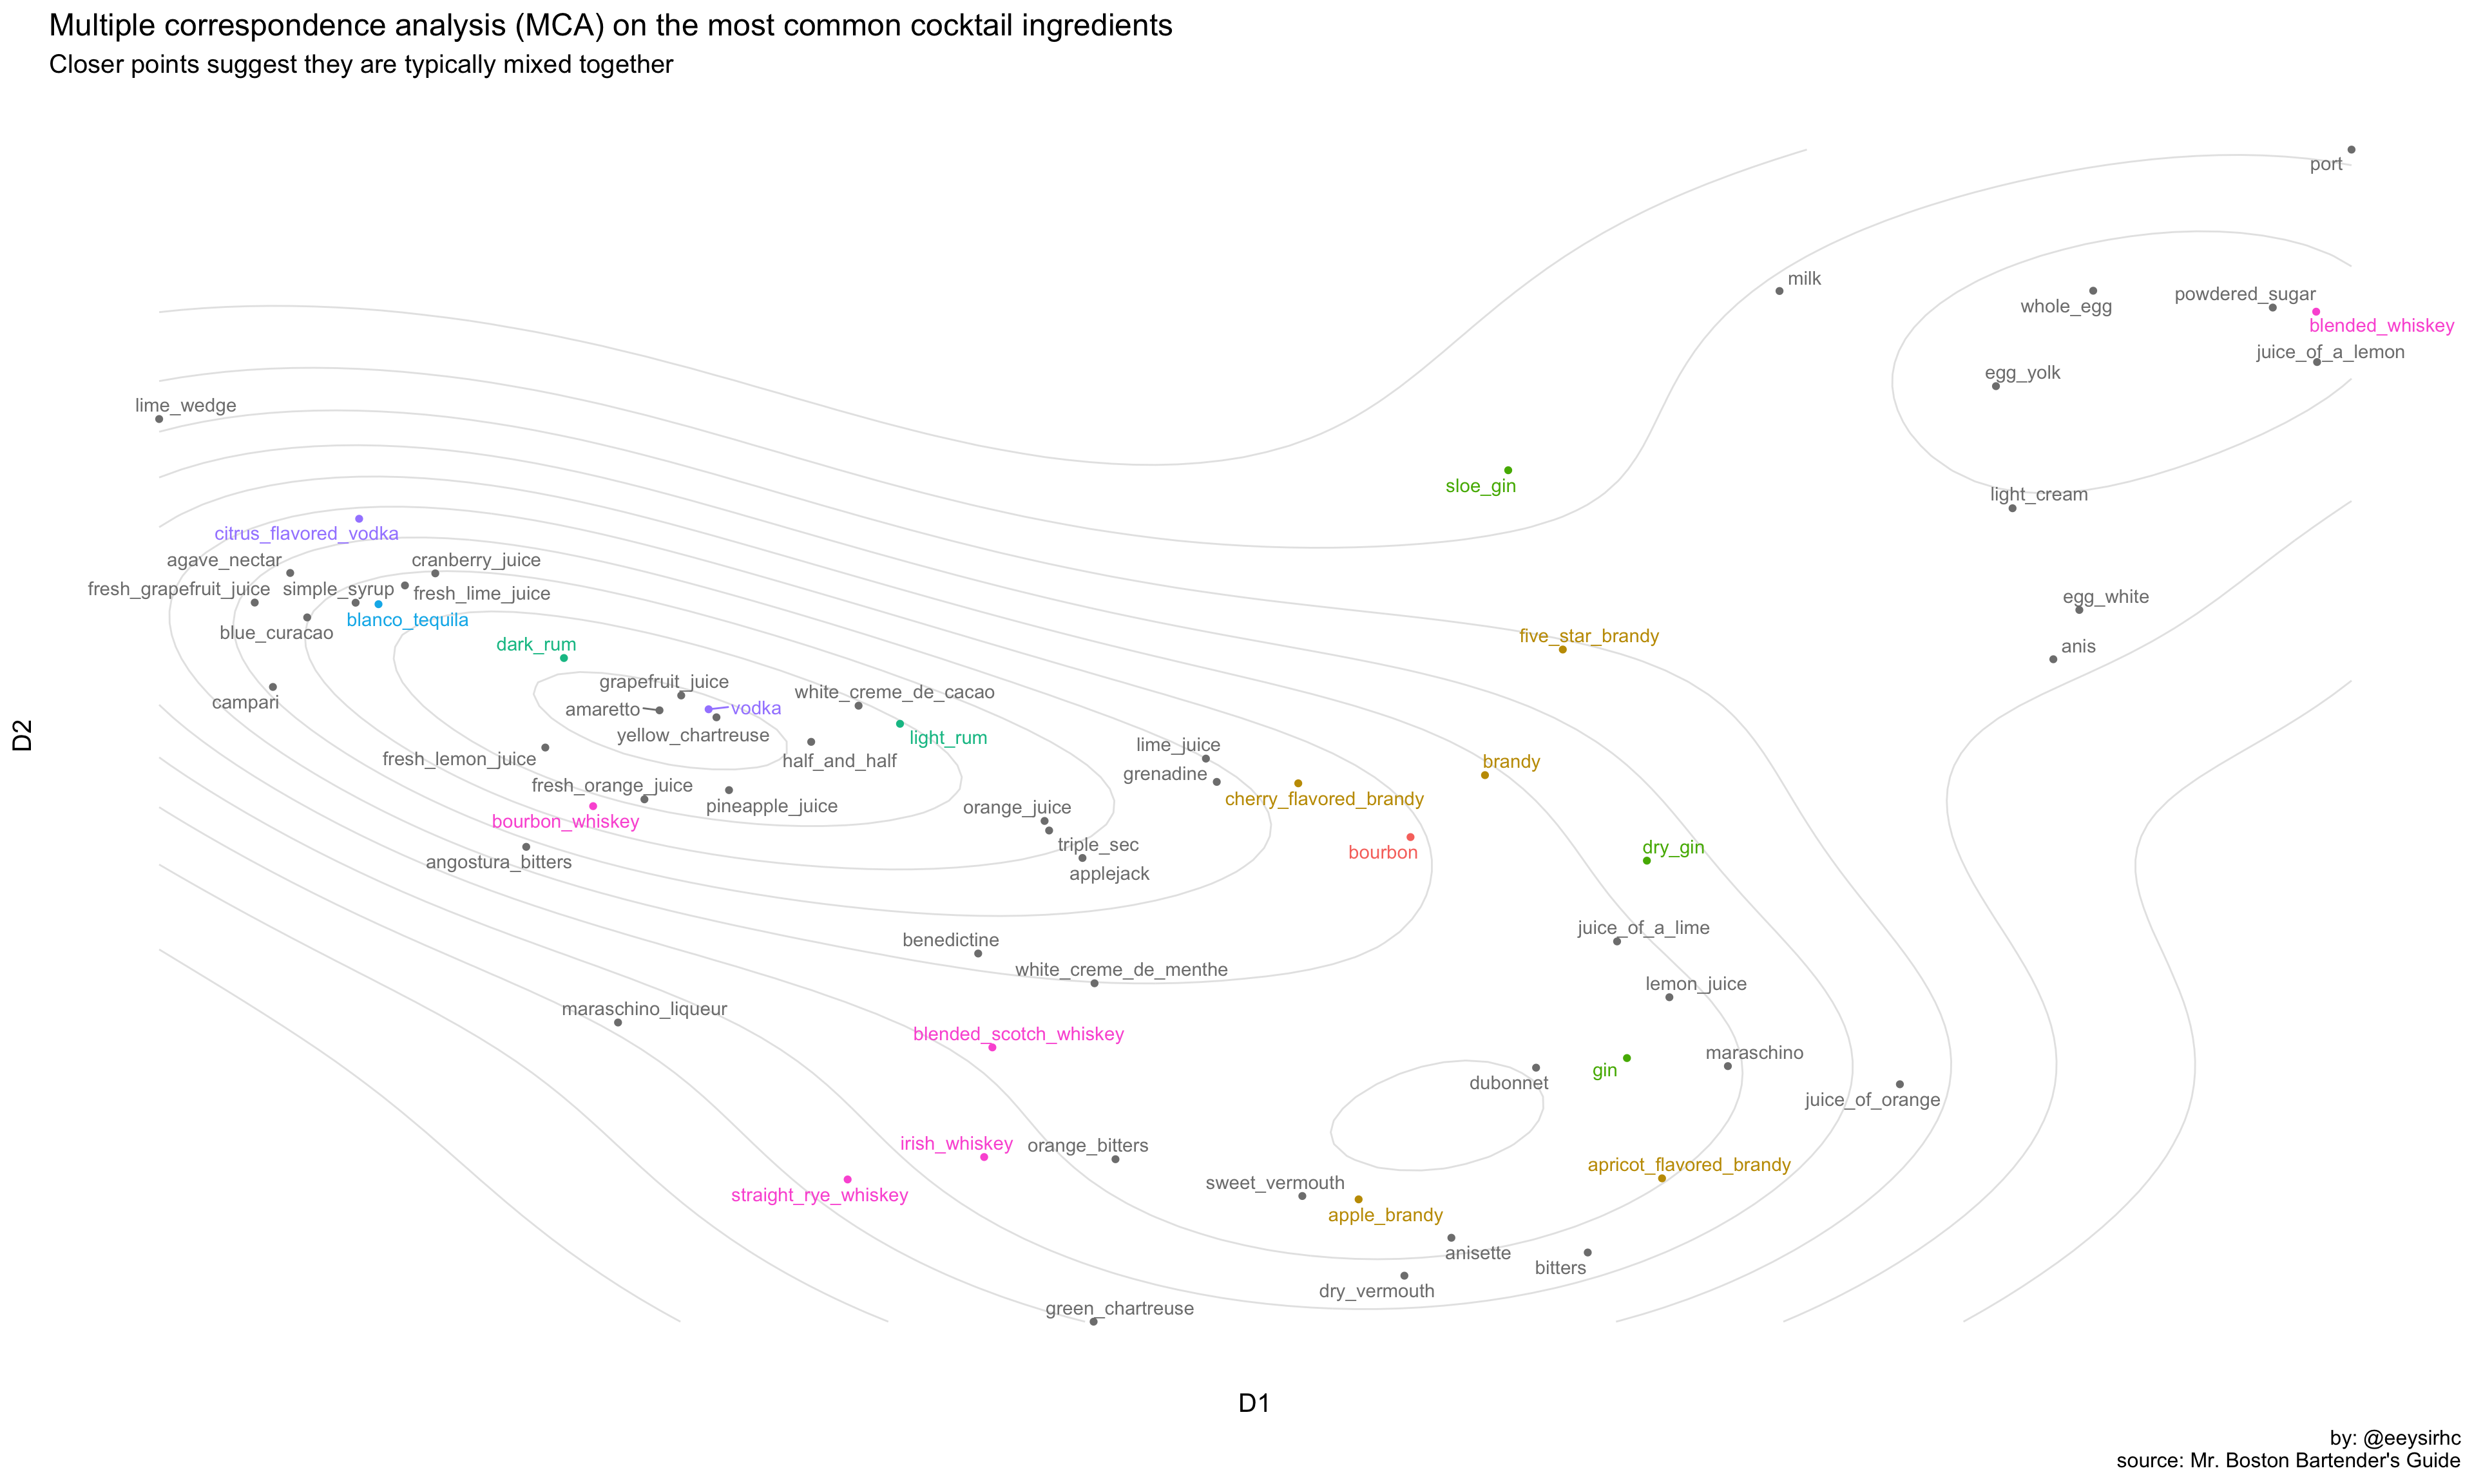
Future work
- Part 2: cocktail recommendation system based on the input of favorite drink
- Calculate and use dissimilarity to recommend a drink to someone based on what they dislike