Analyzing data for #tidytuesday week of 12/11/2018 (source)
# LOAD PACKAGES AND PARSE DATA
library(tidyverse)
library(scales)
library(RColorBrewer)
library(forcats)
library(lubridate)
library(ebbr)
nyc_restaurants_raw <- read_csv("https://raw.githubusercontent.com/rfordatascience/tidytuesday/master/data/2018/2018-12-11/nyc_restaurants.csv")
nyc_restaurants <- nyc_restaurants_raw %>%
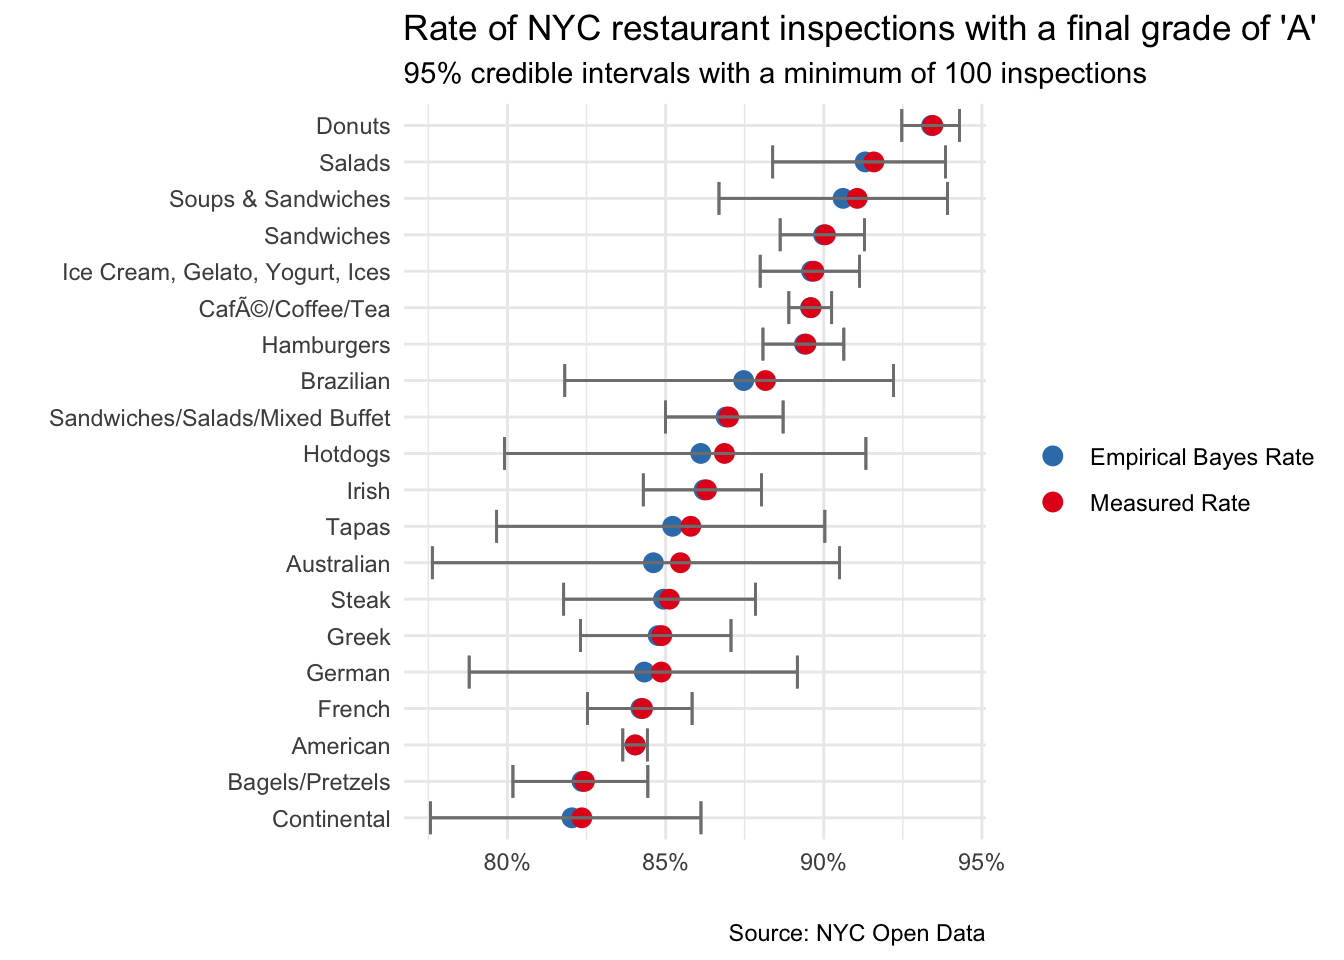
filter(inspection_date != '01/01/1900') What is the rate of “A” inspection grades by cuisine type?
First step is to compute the relevant statistics
cuisine_grades <- nyc_restaurants %>%
  select(cuisine_description, grade) %>%
  na.omit() %>%
  group_by(cuisine_description) %>%
  count(grade) %>%
  mutate(total = sum(n),
         pct_total = n/total) %>%
  ungroup()
Next we apply empirical Bayesian estimation and filter the top 20 results
ebb_cuisine_grades <- cuisine_grades %>%
  add_ebb_estimate(n, total) %>%
  filter(grade == "A") %>%
  arrange(desc(.fitted)) %>%
  filter(n >= 100) %>%
  head(20)
## Warning: `data_frame()` is deprecated as of tibble 1.1.0.
## Please use `tibble()` instead.
## This warning is displayed once every 8 hours.
## Call `lifecycle::last_warnings()` to see where this warning was generated.Plot the graph to compare raw vs Bayesian shrinkage
ebb_cuisine_grades %>%
  select(cuisine_description,
         "Empirical Bayes Rate"=.fitted,
         "Measured Rate"=.raw, .low, .high) %>%
  gather(key, value, -cuisine_description, -.low, -.high) %>%
  ggplot() +
  geom_point(aes(reorder(cuisine_description, value), value, color = key),
             size = 3) +
  geom_errorbar(aes(ymin = .low, ymax = .high, x=cuisine_description),
                color = "gray50") +
  scale_y_continuous(labels = percent_format(round(1))) +
  coord_flip() +
  theme_minimal() +
  labs(x = "",
       y = "",
       title = "Rate of NYC restaurant inspections with a final grade of \'A\'",
       subtitle = "95% credible intervals with a minimum of 100 inspections",
       caption = "Source: NYC Open Data") +
  scale_color_brewer(palette = 'Set1',
                     direction = -1) +
  theme(legend.title=element_blank())