Data from #tidytuesday week of 2019-07-30 (source)
Load R packages
library(tidyverse)
library(RColorBrewer)
library(scales)
Download data
steam_raw <- read_csv("https://raw.githubusercontent.com/rfordatascience/tidytuesday/master/data/2019/2019-07-30/video_games.csv") Parse data
steam_games <- steam_raw %>%

  # VARIABLE FOR AGE OF GAME
  mutate(release_year = substring(release_date, 8, 12), # EXTRACT YEAR
         release_year = as.numeric(str_trim(release_year)),
         release_year = case_when(release_year == 5 ~ 2015, # INCORRECT DATA POINT
                          TRUE ~ release_year),
         age = 2019 - release_year) %>%

  # VARIABLE FOR MIN/MAX NUMBER OF OWNERS
  mutate(max_owners = str_trim(word(owners, 2, sep = "\\..")),
         max_owners = as.numeric(str_replace_all(max_owners, ",", "")),
         min_owners = str_trim(word(owners, 1, sep = "\\..")),
         min_owners = as.numeric(str_replace_all(min_owners, ",", ""))) %>%

  # REMOVE VALUES WITH INCONSISTENT RELEASE_DATE FORMAT (n=37)
  filter(age < 15) %>%

  # FILTER OUT STUDIO SOFTWARE
  filter(price < 150)
Visualize data
Question: how many people still play games that are X years old (on Steam) ?
steam_games %>%
  select(age) %>%
  ggplot() +
  geom_histogram(aes(as.factor(age)),
                 binwidth = 1,
                 stat = 'count',
                 fill = 'steelblue',
                 alpha = 0.8) +
  scale_y_continuous(labels = comma_format()) +
  labs(x = "Years Since Release",
       y = NULL,
       title = "Count of active games on Steam since release",
       caption = "by: @eeysirhc\nsource: Steam Spy") +
  theme_light()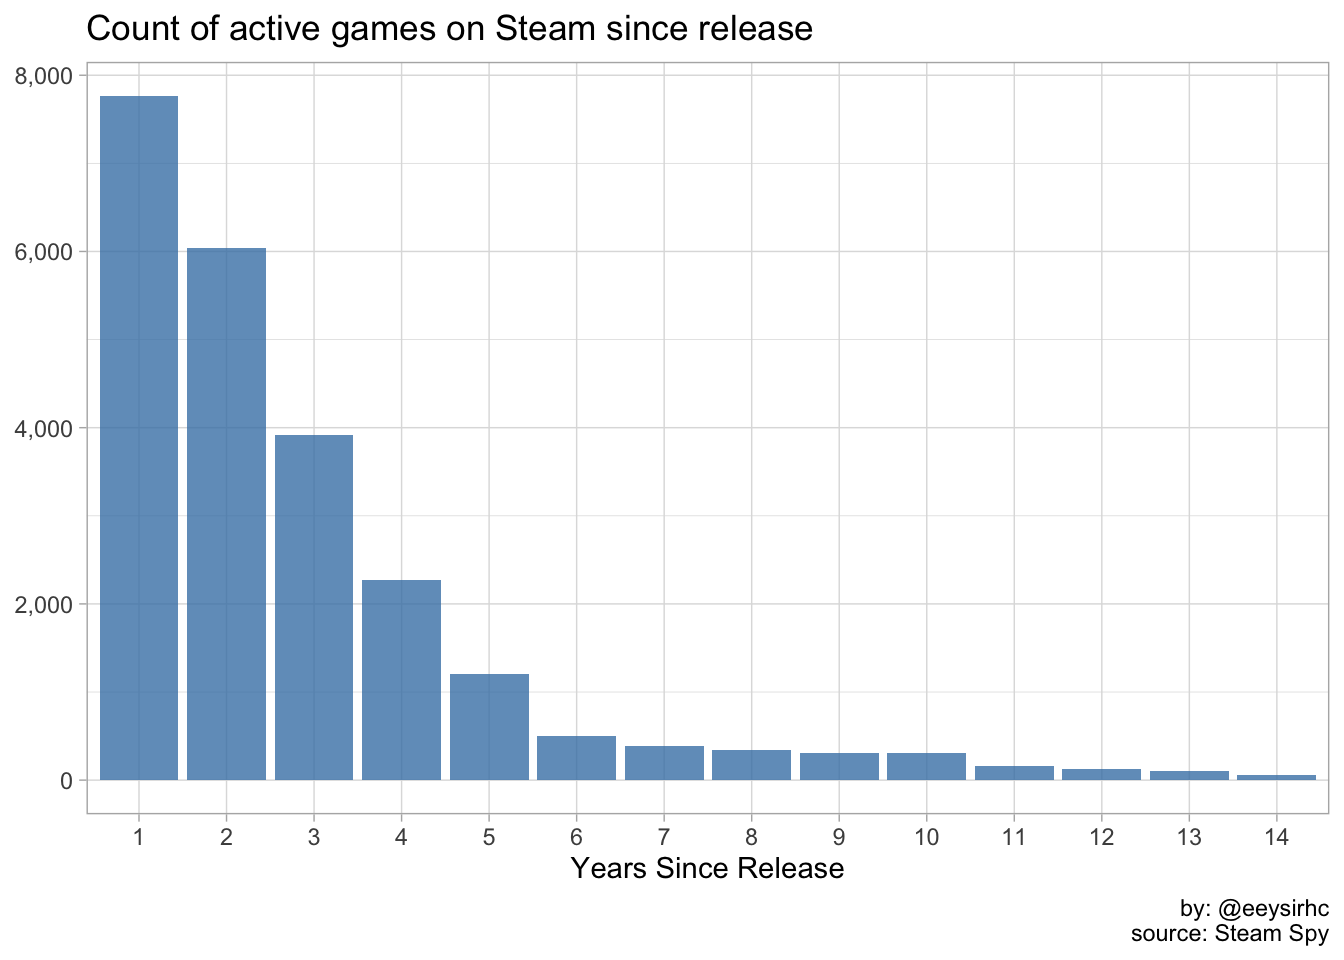
Question: What is the distrubtion of game ownership for the top publishers ?
steam_games %>%
  select(-number, -release_date) %>%
  mutate(max_owners = as.factor(max_owners / 1000000)) %>%
  group_by(publisher) %>%
  mutate(n = n()) %>%
  ungroup() %>%
  filter(n >= 80, publisher != 'NA') %>%
  mutate(publisher = paste0(publisher, " (", n, ")"),
         publisher = reorder(publisher, desc(n))) %>%
  ggplot(aes(publisher, max_owners, color = publisher)) +
  geom_jitter(show.legend = FALSE, size = 3, alpha = 0.5) +
  scale_color_brewer(palette = 'RdBu') +
  theme_light() +
  labs(x = NULL,
       y = "Estimated Game Ownership per Million",
       title = "Distribution of ownership for top game publishers",
       subtitle = "(n) indicates total titles released",
       caption = "by: @eeysirhc\nsource: Steam Spy") +
  theme(panel.background = element_rect(fill = 'grey95'),
        plot.background = element_rect(fill = 'grey95'),
        panel.grid.major = element_blank(),
        panel.grid.minor = element_blank(),
axis.text.x = element_text(angle = 45, hjust = 1)) 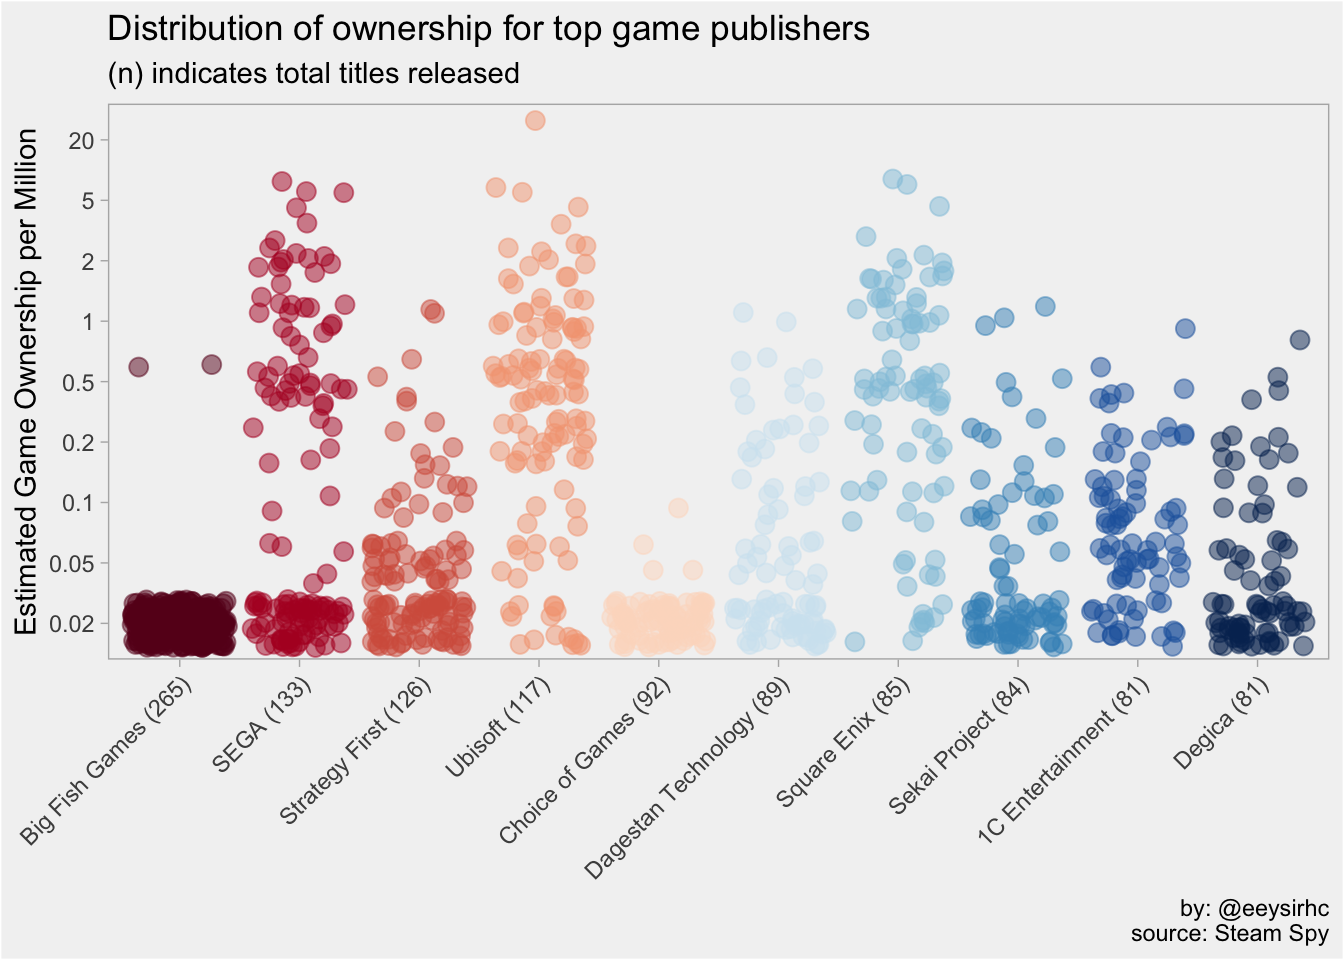
Interesting takeaways
- Mass Market: whether it is their distribution network or brand name, publishers such as Ubisoft (117) and Square Enix (85) manage to consistently break into the 1M+ user base categories.
- Some Hits Mostly Miss: majority of the top publishers will fall in this category like Strategy First (126) or Degica (81) where a few game titles will break 50K or 100K users but majority will fall in the 20K bucket.
- Niche Market: publishers like Big Fish Games (n=265) and Choice of Games (n=92) have a lot of titles under their belts where each game acquires no more than 20K users. It is possible they do not want to compete against major publishers like Ubisoft or SEGA but instead choose to churn out games which cater to a super niche audience.