The SEM industry has published a lot of information about the importance of improving quality score to lower average cost per click (CPC).
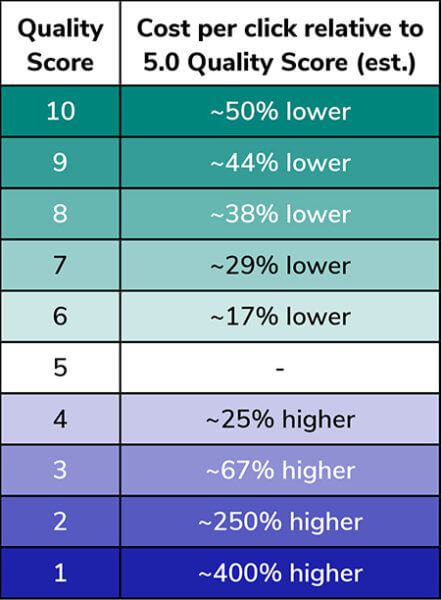
Most of those articles, however, just share a table with quality score in one column and its associated % increase/decrease to average CPC in the other. Although helpful I think it misses the mark on underscoring the magnitude of how much QS can help CPC.
We will do something different: the python code below will take that data and visualize the impact to average CPC for a given quality score.
Load modules
import pandas as pd
import numpy as np
import matplotlib.pyplot as plt
import seaborn as sns

sns.set_style("darkgrid")
Set QS multipliers
multiplier = [4, 2.5, 0.67, 0.25, 0, -0.17, -0.29, -0.38, -0.44, -0.50]

impact = []
for m in multiplier:
    data = m + 1
    impact.append(data)
Define functions
# CALCULATE AVG CPC FOR A SPECIFIC QS MULTIPLIER
def qs_calc(cpc, cpc_impact):
    return round(cpc * cpc_impact, 2)

# LOOP THROUGH EACH QS MULTIPLIER FROM A PROVIDED CPC
def qs_estimate(cpc):
    estimate = []
    for i in impact:
        data = qs_calc(cpc, i)
        estimate.append(data)
    return estimate
Estimate Avg CPC
We’ll assume the account has an average cost per click of $0.50 with a standard deviation of $0.10.
estimate_range = []
for i in np.random.normal(0.50, 0.10, 1000):
    data = qs_estimate(i)
    estimate_range.append(data)
Standardize data frame
df_range = pd.DataFrame.from_records(estimate_range).reset_index()
df_range = pd.melt(df_range, id_vars=['index'], var_name="quality_score", value_name="estimated_cpc")
df_range.quality_score = df_range.quality_score + 1
Visualize
plt.figure(figsize=(15,10))

sns.boxplot(x='quality_score', y='estimated_cpc', palette='Paired', data=df_range)
plt.xlabel("Quality Score")
plt.ylabel("Estimated CPC")
plt.figtext(0.9, 0.07, "by: @eeysirhc", horizontalalignment="right")

plt.show()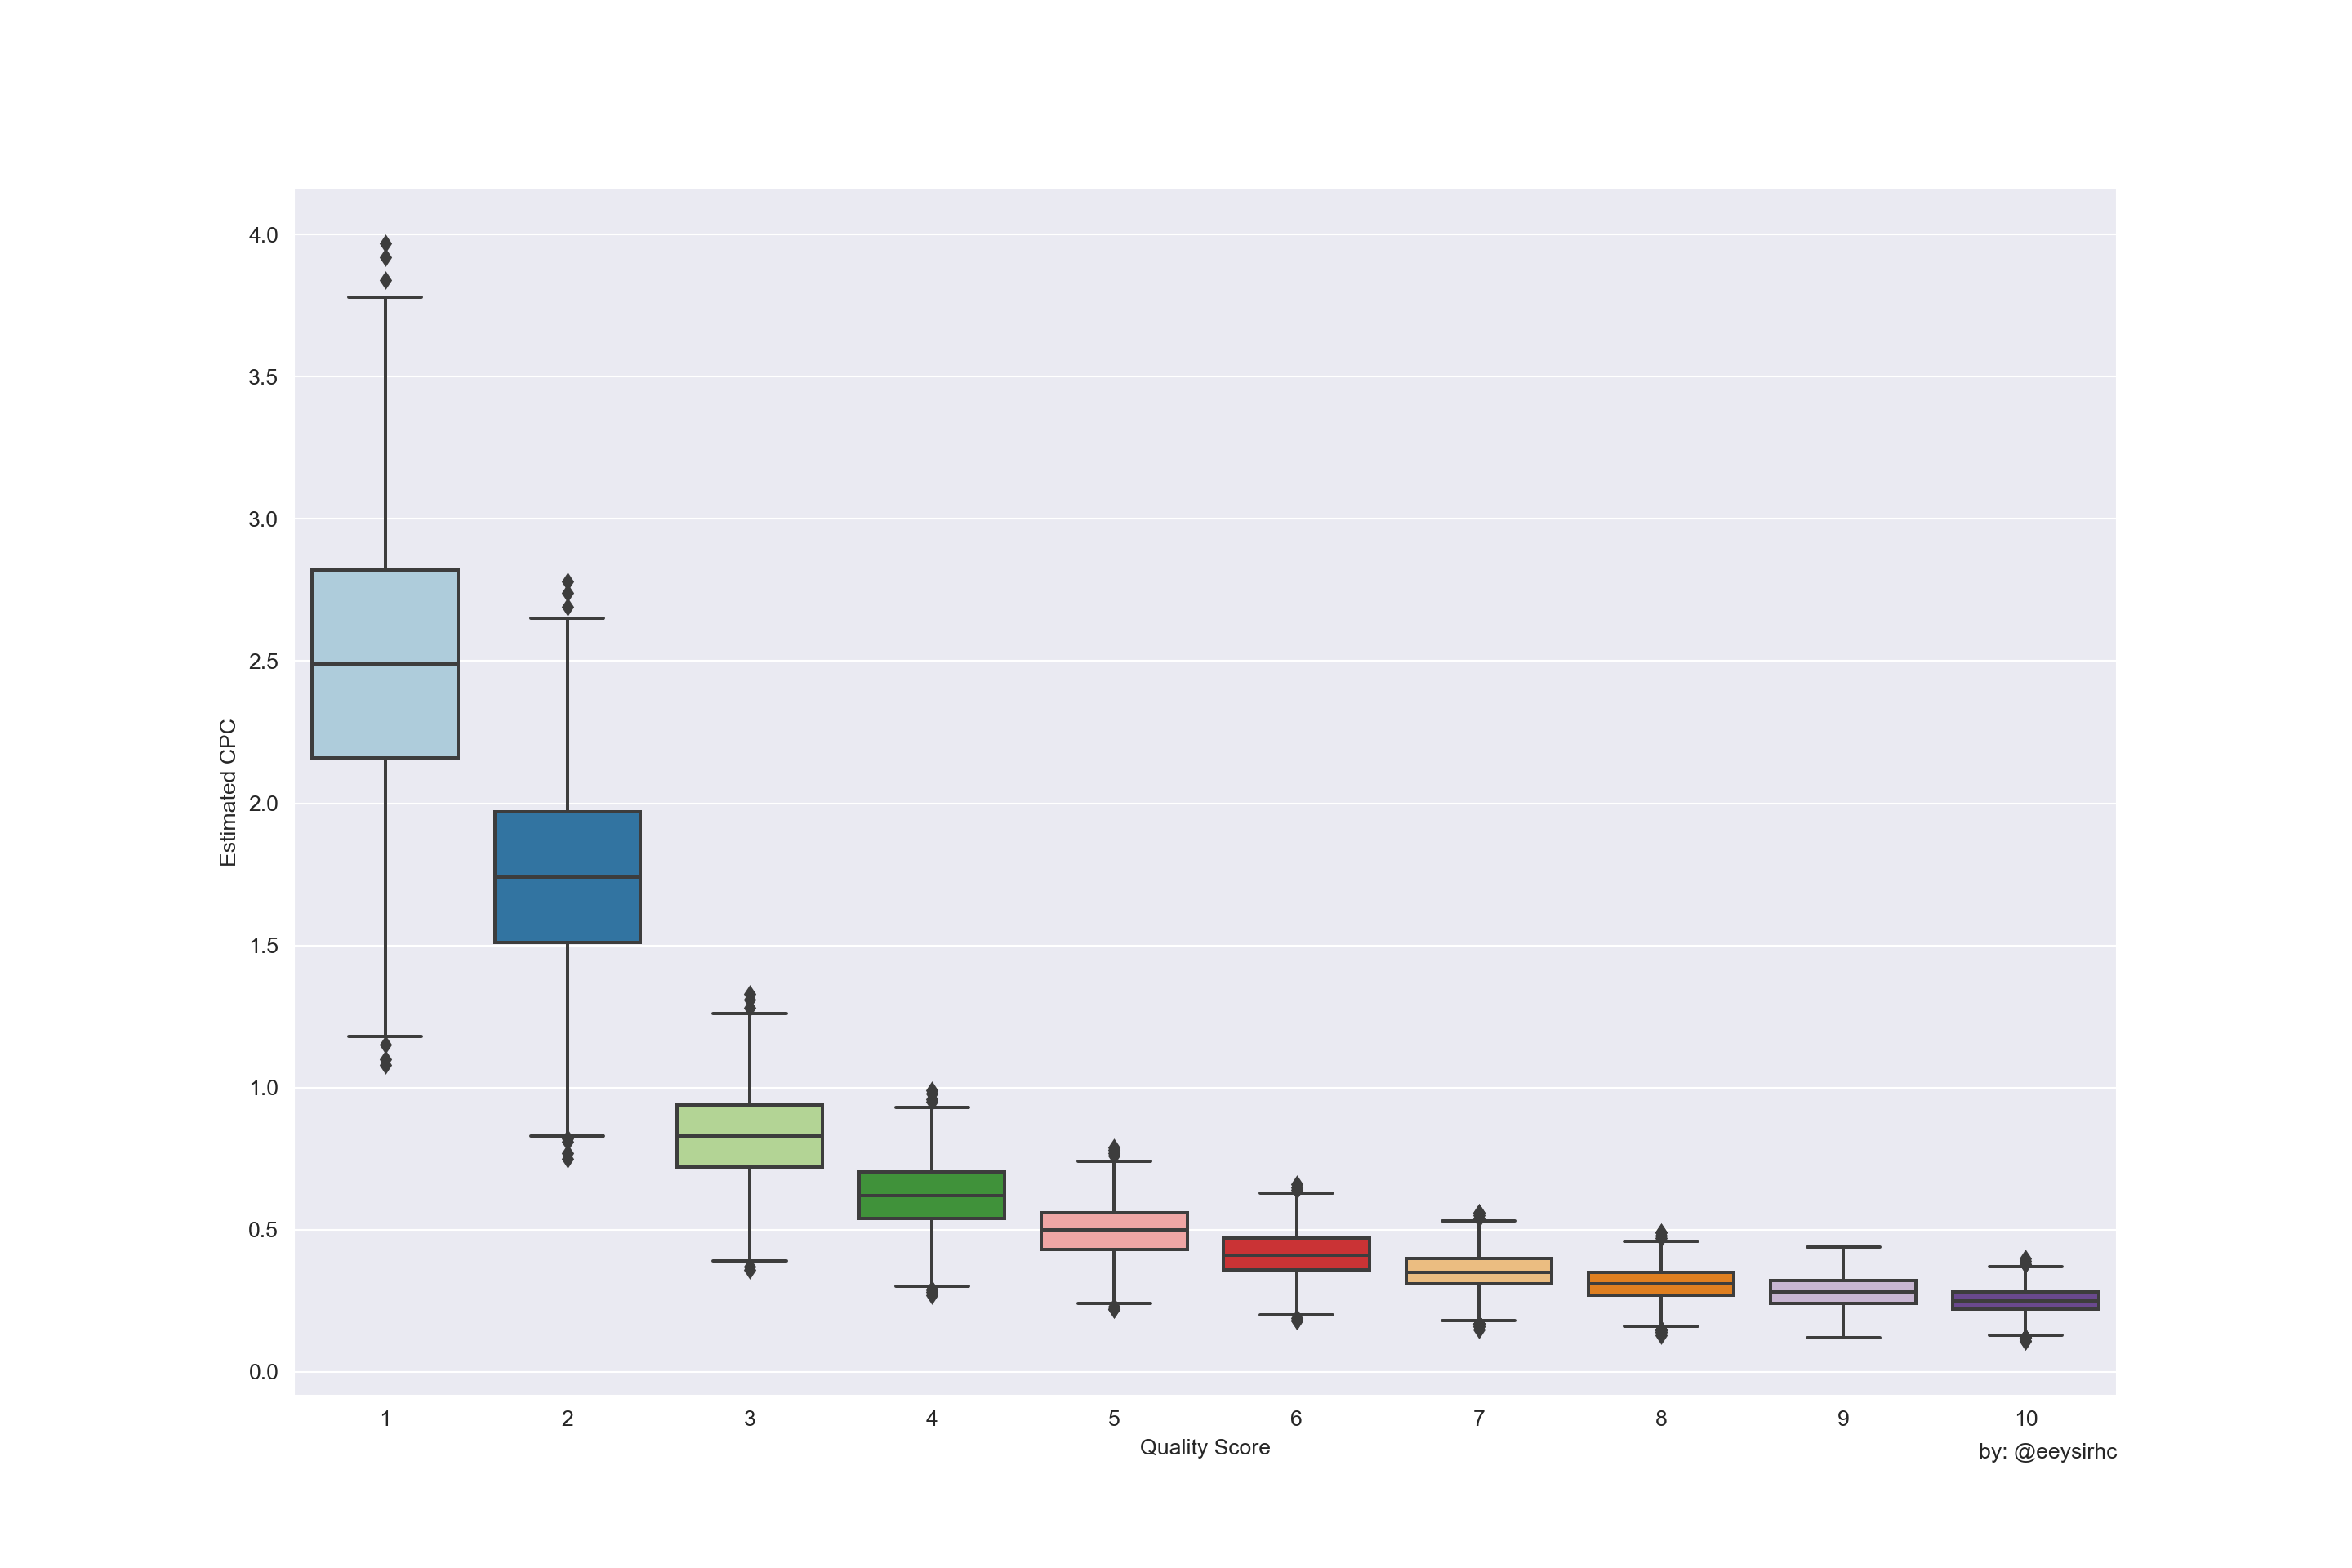
Now we have something a little more digestible:
- At $0.50, the average CPC can shoot up to $2.50 (or more) with a quality score of 1
- With a higher quality score we observe a slight decrease in CPC compared to the average
- There is a significant difference in costs if we move ads with QS < 5 to improve by a level or two