My original exploratory analysis on the topic can be found at Firearm Sales: How are Americans coping with 2020?
This post is a quick #rstats follow-up to visualize the final tally for 2020 data.
Load libraries
library(tidyverse)
library(lubridate)
library(scales)
Download & parse data
df_raw <- read_csv("https://raw.githubusercontent.com/BuzzFeedNews/nics-firearm-background-checks/master/data/nics-firearm-background-checks.csv")

df <- df_raw

df_clean <- df %>%
  filter(month >= "2016-01" & month < "2021-01") %>%
  select(month, state, handgun, long_gun) %>%
  arrange((month)) %>%
  mutate(month = as.Date(paste0(month, "-01"))) %>%
  group_by(month) %>%
  summarize(handgun = sum(handgun),
            long_gun = sum(long_gun)) %>%
  mutate(index_month = as.factor(month(month, label = TRUE)),
         index_year = as.factor(year(month))) %>%
  ungroup()
Visualize data
df_clean %>%
  group_by(index_year) %>%
  mutate(handgun = cumsum(handgun),
         long_gun = cumsum(long_gun)) %>%
  ungroup() %>%
  select(month, index_month, index_year, handgun, long_gun) %>%
  pivot_longer(handgun:long_gun, names_to = "type") %>%
  ggplot(aes(index_month, value, color = index_year, group = index_year)) +
  geom_line() +
  geom_point() +
  scale_y_continuous(labels = comma_format()) +
  scale_color_brewer(palette = 'Paired') +
  expand_limits(y = 0) +
  facet_grid(type ~ .) +
  labs(color = NULL, x = NULL, y = NULL,
       title = "NICS Firearm Background Checks: monthly cumulative per year by type",
       caption = "by: @eeysirhc\nsource: Federal Bureau of Investigation") +
  theme_bw() +
  theme(legend.position = 'top')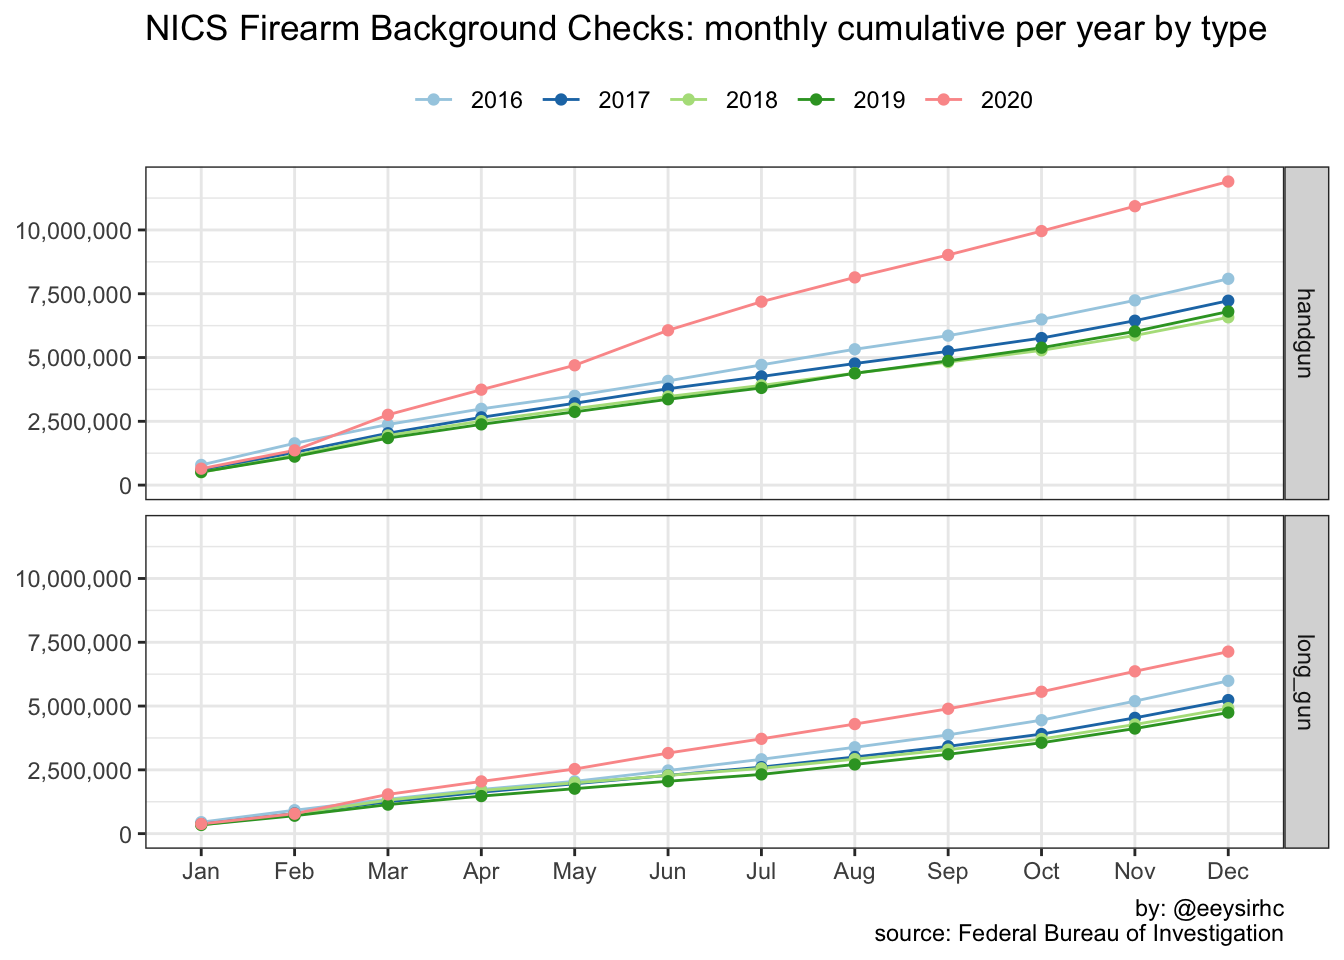
With the above completed we now have a year-over-year summary:
- Handgun: +75% increase for an incremental 5.1M in circulation compared to +3% and 226K from the previous year
- Long gun: +50% increase which is an extra 2.4M in the public as opposed to a -4% decline and -172K from the year prior