A couple weeks ago, a friend asked me about my base annual salary during my time as Square’s SEO Lead.
Rather than spitting out a number, I thought it would be more interesting to see if we could answer her question using #rstats.
tl;dr
This is what I posted on Twitter:
Ok #bayesian twitter: helping a friend with salary negotiations and this incorporates what she wants, job boards, confirmed salaries, etc……how do I validate if this model is a load of crock or not? pic.twitter.com/WUfcdHBtUX
— Christopher Yee (@Eeysirhc) November 7, 2019
In the off chance someone smart stumbles across this, it would be great to hear how I can validate goodness of fit? I suspect I am missing the loss function here but unsure of how to code it.
The problem
If you ask anyone in the SEO industry, people will have a general idea of what the potential salary might be for a “Director of SEO” in San Francisco. One person might say it’s anywhere between $280K-$350K per year while another will state $150K-$230K.
However, webistes like Glassdoor might give a range of $107K-$200K.
Who should you trust and how do you know you’re not under cutting your own value or shooting way over the fence? All of the above are very possible values but how do we get more confident about where that true value may lie?
Objective
The purpose of this article is to provide a full code walkthrough on how you can build your own model to answer the question: what is the estimated salary range for a given position?
In my opinion, there are three reasons why I think this will be helpful for any job seeker:
- Job aggregation websites provide these statistics but there is a lot of variance between them
- Everyone will have wildly different guesses on the base salary
- This can improve your confidence during salary negoations if you are over/under indexing to that of the market
My goal is to incorporate all three data sources and determine what that salary might be. For our use case we’ll try to estimate the base salary in San Francisco, CA for a “Director of SEO.”
Approach: the uniform distribution
The answers for these questions typically have a range of values: from a minimum of $X to a maximum of $Y.
Unlike my previous articles using the normal distribution, this is the perfect use case for the uniform distribution. According to Wikipedia:
…there is an arbitrary outcome that lies between certain bounds…all intervals of the same length on the distribution’s support are equally probable.
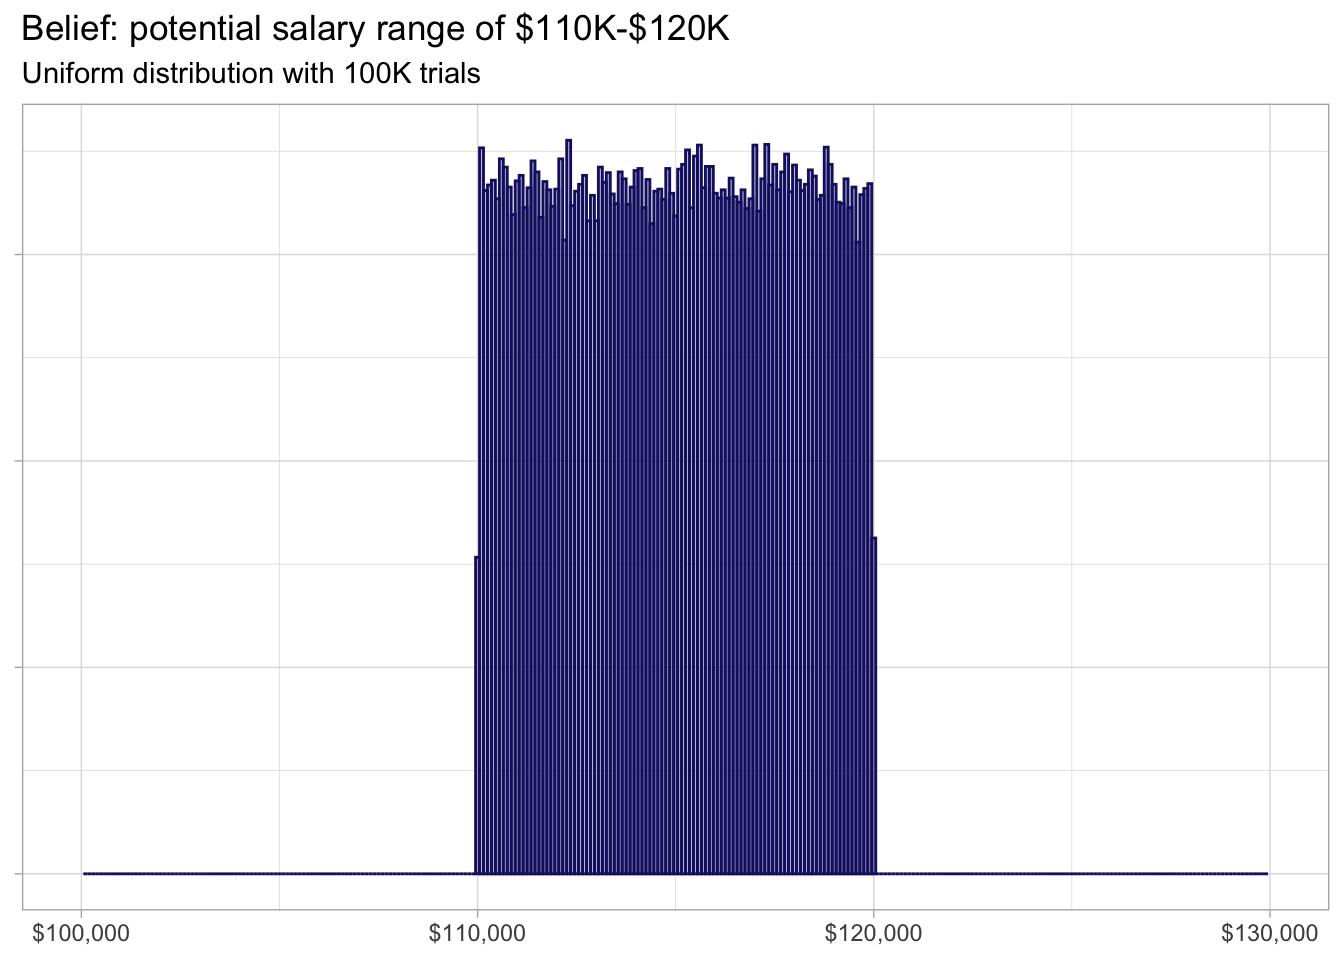
Thus, someone can believe the “SEO Director” position might have a salary range of $110K-$120K. If they meet someone with that job title, they may be inclined to think that person’s gross annual take home pay can be $111K but $119K is also just as likely. However, it will only stay within those upper and lower bounds.
Load libraries
library(tidyverse)
library(scales)
Simulation function for the uniform distribution
This will generate 100K trials for each variable we create.
salary_sim <- function(min_salary, max_slary, segment){
  values <- runif(1e5, min_salary, max_slary) %>%
    as_tibble() %>%
    mutate(segment = paste0(segment))
}
If you want to learn more about this then check out my article about R functions for data simulation, sampling & visualization
Generate our dataset
I checked a number of job listing websites where I set the search location to “San Francisco, CA” for “Director of SEO.” I then created the variables below using our salary_sim function:
glassdoor <- salary_sim(107000, 223000, "glassdoor")
indeed <- salary_sim(90000, 150000, "indeed")
payscale <- salary_sim(125000, 176000, "payscale")
ziprecruiter <- salary_sim(143990, 195498, "ziprecruiter")
salary <- salary_sim(170121, 233854, "salary")
comparably <- salary_sim(115148, 173020, "comparably")
We want to include what other people think the salary range is based on their own professional experiences. I started with a few but feel free to add your own!
guess1 <- salary_sim(180000, 300000, "guess1")
guess2 <- salary_sim(150000, 300000, "guess2")
guess3 <- salary_sim( 180000, 250000, "guess3")
The data illustrates a wide range of base salaries - there are some in the low $100K but others as high as $300K per anum.
salary_range <- rbind(glassdoor, indeed, payscale, ziprecruiter, salary,
                      comparably, guess1, guess2, guess3)

salary_range %>%
  ggplot(aes(value, fill = segment, color = segment)) +
  geom_density(alpha = 0.5) +
  scale_x_continuous(limits = c(50000, 350000),
                     labels = dollar_format()) +
  labs(x = NULL, y = NULL) +
  facet_wrap(~segment, ncol = 3) +
  theme_light() +
  theme(axis.text.y = element_blank(),
        legend.position = 'none')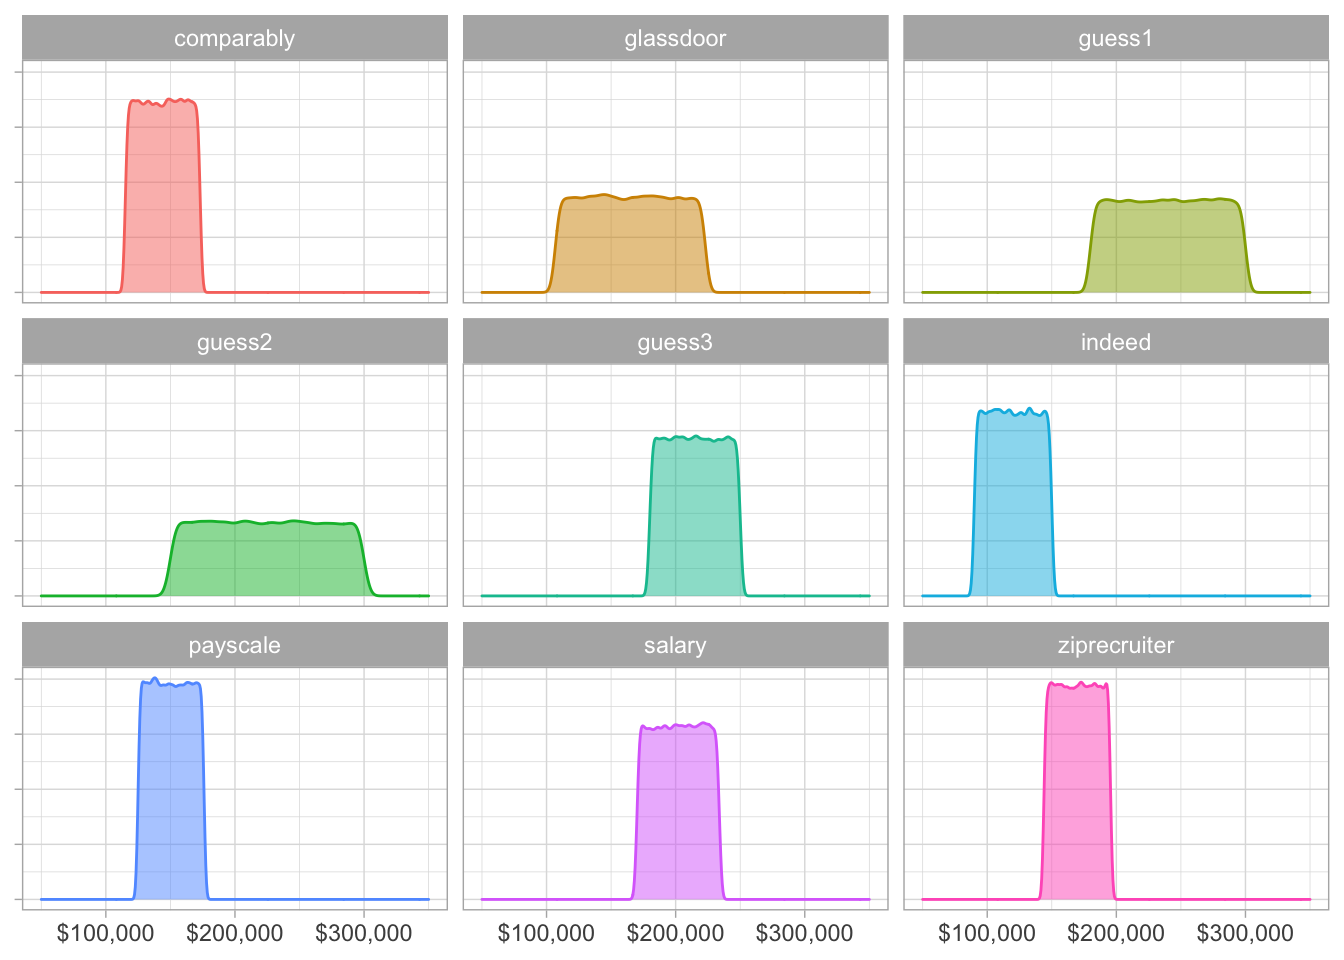
With values all over the place, how do we know what is an acceptable salary proposal? Something you are happy with but also realistic to that of the market?
The great thing is we can include that in our model and call this variable the sweet_spot. Let’s use a minimum of $120K and a maximum of $160K:
sweet_spot <- salary_sim(120000, 160000, "sweet_spot")Making decisions
We can now combine all of our data to quantify what salary range we would be happy with if we accept an offer as “Director of SEO” in San Francisco:
potential <- ((glassdoor$value +
                 indeed$value +
                 payscale$value +
                 ziprecruiter$value +
                 salary$value +
                 comparably$value +
                 guess1$value +
                 guess2$value +
                 guess3$value +
                 sweet_spot$value) / 10) %>%
  as_tibble() %>%
  mutate(segment = paste0("potential"))

output <- rbind(potential, sweet_spot)
And then plot our result:
output %>%
  ggplot(aes(value, fill = segment, color = segment)) +
  geom_density(alpha = 0.5) +
  scale_x_continuous(limits = c(80000, 250000),
                     labels = dollar_format()) +
  labs(x = NULL, y = NULL, fill = NULL, color = NULL,
       title = "Estimated base salary range for Director of SEO in San Francisco, CA",
       caption = "Uniform distribution from 10 sources with 100K trials each") +
  theme_light() +
  theme(axis.text.y = element_blank()) +
  theme(legend.position = 'top')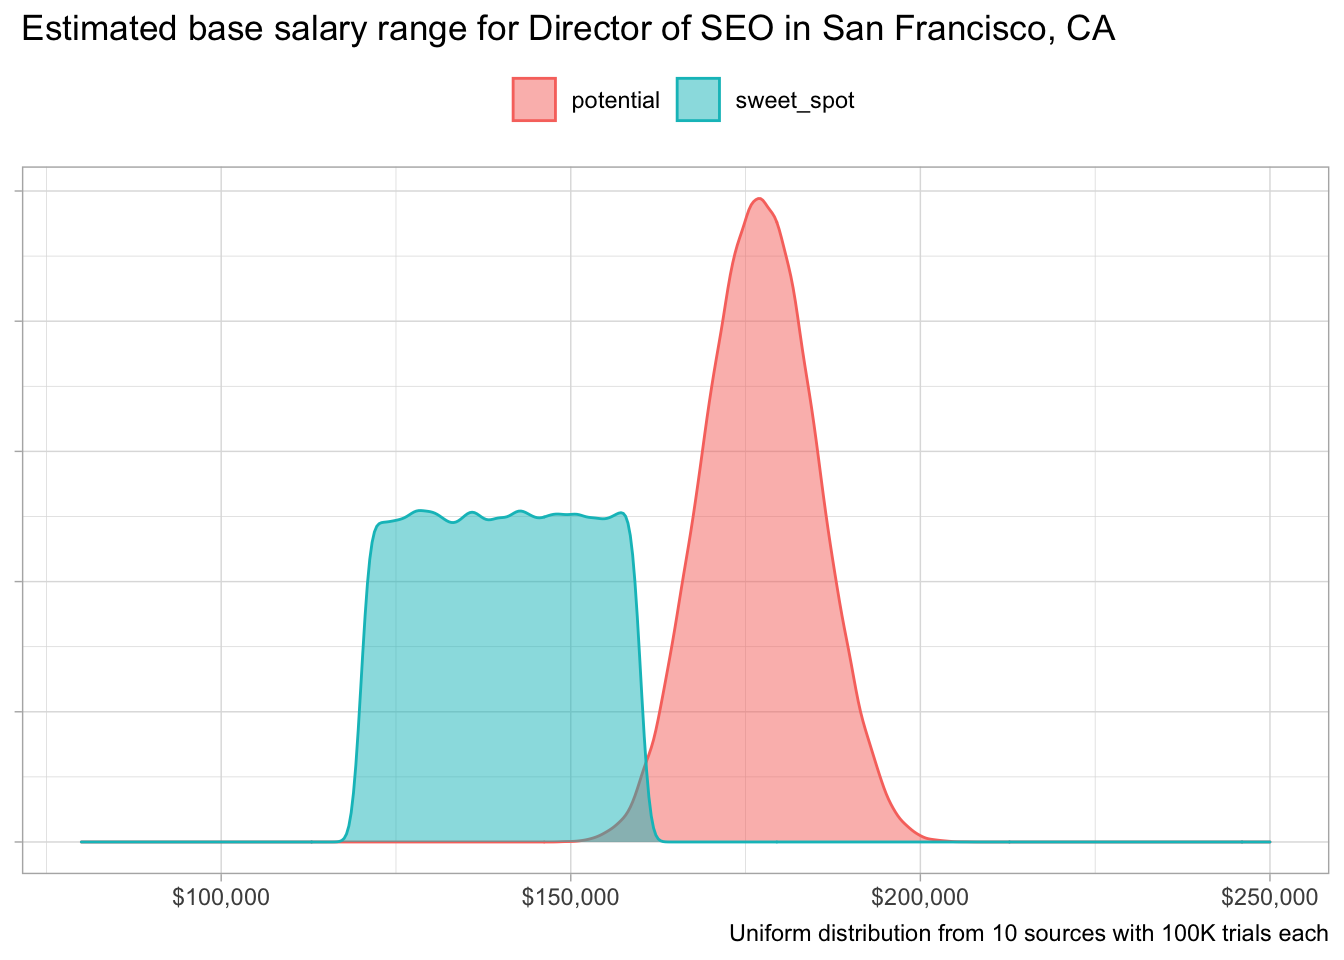
A few interesting call outs here. First, we know our sweet_spot is way too low. Our max value is $160K but the average for the potential segment is:
mean(potential$value)## [1] 177093.4That is more than $17K difference from what we were expecting!
Second, we can quantify the probability we should be asking for more than our maximum value of $160K:
sum(potential$value > 160000) / length(potential$value) * 100## [1] 98.842The recommendation to my friend: definitely ask for more!
Ignore specific data
It’s very likely someone will not believe the statistics they see on these websites and think they should be paid more.
In my opinion, the beauty in this approach is we can incorporate their beliefs as well if they want to exclude specific data.
Let’s take a hypothetical person who thinks they should be making anywhere between $230K-$330K per year as an “SEO Director” in San Francisco. Maybe they want to kick out some of the lower end salary ranges and retain only the values on the premium side.
Here’s what that code might look like and we’ll compare it with our first candidate:
sweet_spot2 <- salary_sim(230000, 330000, "sweet_spot2")

potential2 <- ((glassdoor$value +
                 ziprecruiter$value +
                 salary$value +
                 guess1$value +
                 guess2$value +
                 guess3$value +
                 sweet_spot2$value) / 7) %>%
  as_tibble() %>%
  mutate(segment = paste0("potential2"))

output2 <- rbind(potential, potential2, sweet_spot2)
…and to plot our results:
output2 %>%
  ggplot(aes(value, fill = segment, color = segment)) +
  geom_density(alpha = 0.5) +
  scale_x_continuous(limits = c(80000, 400000),
                     labels = dollar_format()) +
  scale_fill_brewer(palette = 'Set2') +
  scale_color_brewer(palette = 'Set2') +
  labs(x = NULL, y = NULL, color = NULL, fill = NULL,
       title = "Estimated base salary range for Director of SEO in San Francisco, CA",
       caption = "Uniform distribution from 7 sources with 100K trials each") +
  theme_light() +
  theme(axis.text.y = element_blank(),
        legend.position = 'top')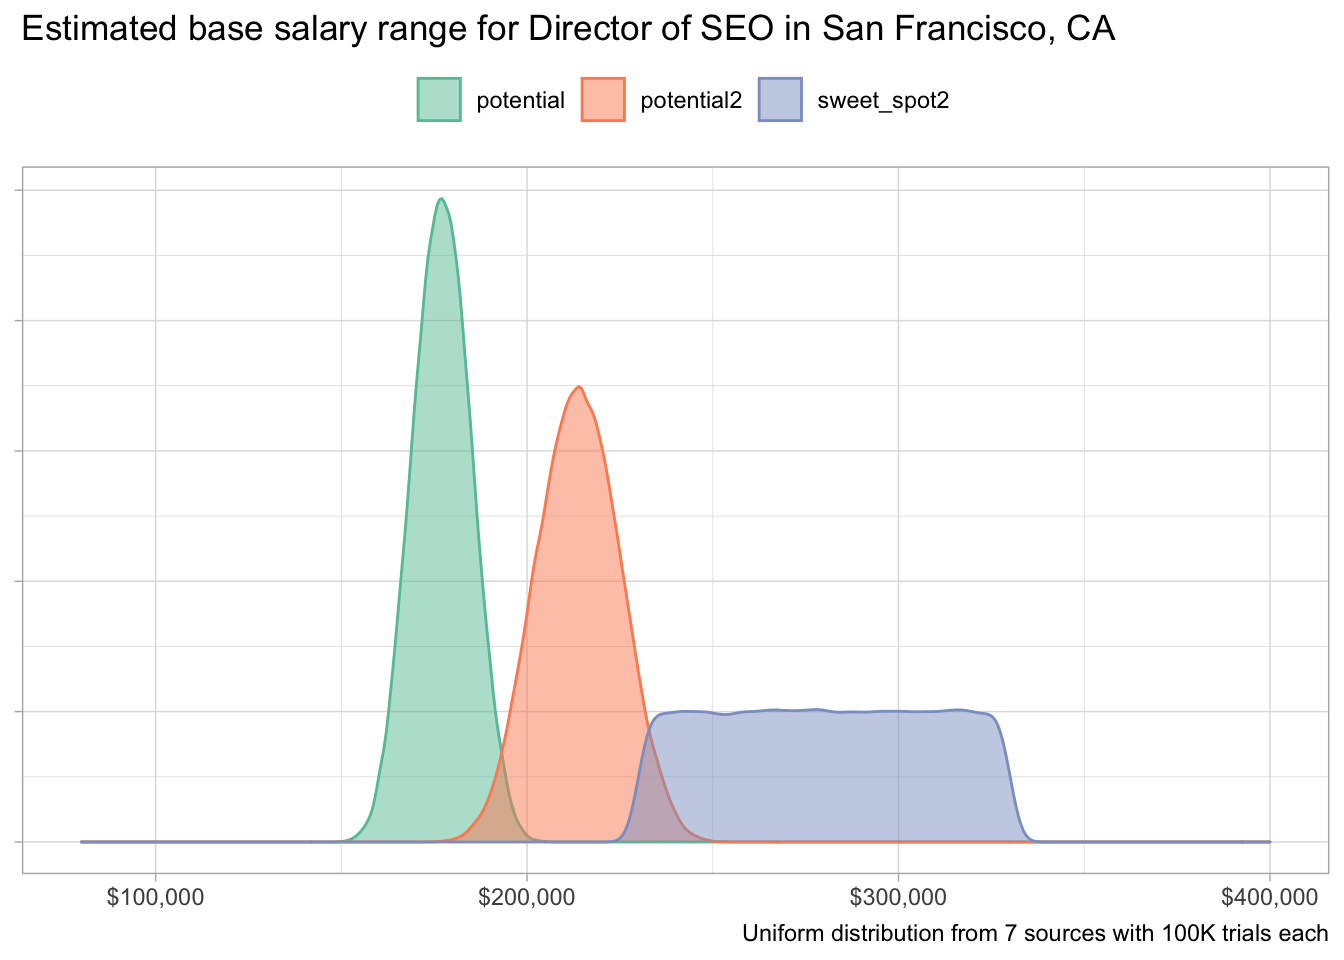
So, how confident should this person be in asking for at least a $230K annual salary?
sum(potential2$value > 230000) / length(potential2$value) * 100## [1] 7.284End note
This was a fun exercise for me in how someone can use R to bring certainty into an uncertain world.
With that being said, consider this just one of many tools in your negotations toolbox to help you achieve the salary you want.
Below are two awesome responses from people I respect:
It's persuasion and tapping emotions that get the desired salary, not stats.
— Tony Spencer (@notsleepy) November 7, 2019
If you don’t actively advocate for yourself, no one else will nor should you expect them to.
— Yuriy (@YuriyYarovoy) November 7, 2019
If it’s easier for you to leave a job instead of asking for a raise, the issue isn’t the job or pay, it’s your ability to have uncomfortable conversations.